
The Jobs Number
 I generally try to write about matters that are particularly relevant to public funds investors but this piece is more general. Macroeconomic matters affect us all. As I read through Congressional Budget Office analysis of the budget/deficit situation last week I was struck by the importance of underlying trends in population, labor force and productivity. So here goes.
In recent years The Number, released on the first Friday of each month, has been a market obsession. We’ve become accustomed to increases in nonfarm payrolls of more than 200,000, to the point where last month’s report (with revisions to prior months) of growth that averaged 35,000 for the last three months led to a political firestorm and the firing of the messenger, the head of the Bureau of Labor statistics.
But what if the recent results are the new norm? There is reason to believe this could be, and they lie in the underlying demographic trends that will limit growth in the working age population and the labor force. That could mean a slow pace of economic growth, stresses on businesses and organizations that have trouble hiring workers with the skills they desire, and upward pressure on labor costs (aka inflation).
That’s not a pretty outlook, but it could be what’s in store for the U.S. economy in coming years. Unless.
Unless productivity spurts higher, the promise that some artificial intelligence evangelists preach.
It’s all quite complicated, and a bit speculative, but important to keep in mind when trying to make sense of the September jobs report that we’ll see on Friday.
The Details.
In the last five years employment growth has averaged a bit over 300,000 a month (below chart), fueled by the COVID recovery, but the pace has tailed off significantly. Obsession with monthly figures can obscure important underlying trends. In this case, the trend of stagnating labor supply. In simple terms, years of population growth are behind us, and the forecast is for weak growth in population and labor force coming years.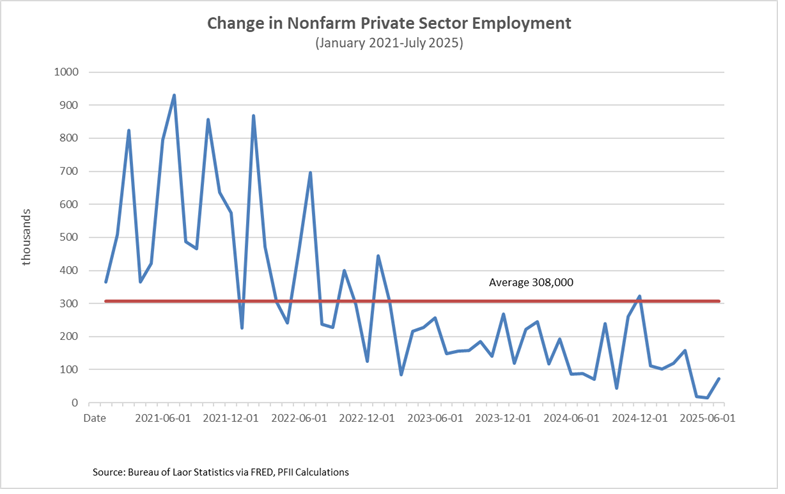
The changes in the relationship between population and labor force growth over the past 50 years or so can be attributed to the Baby Boomers entering the working age population (from 1962-1992) and more recently aging out, without being fully replaced by new births and immigration.
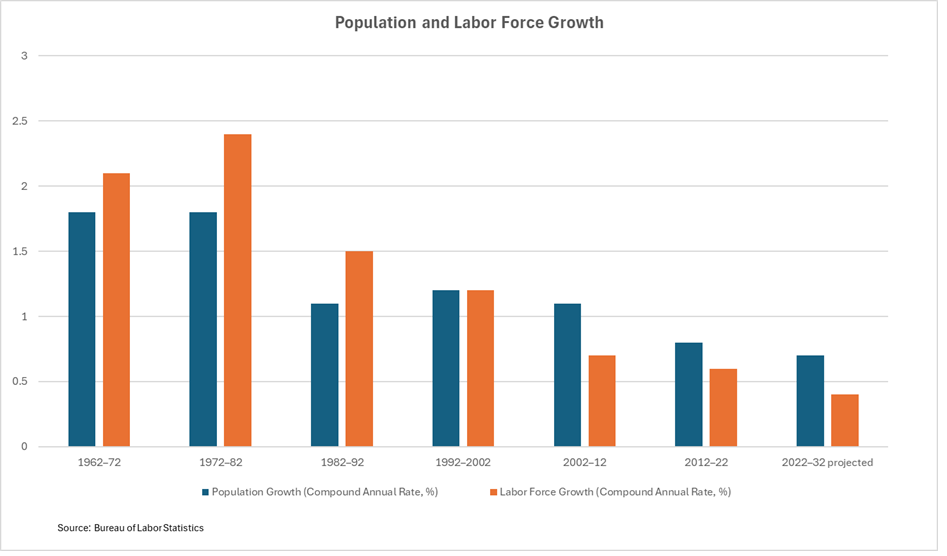
The result is that labor force growth will (likely) decline. If so, employment growth will average about 40,000 a month over the next decade. That’s the most that the population can support without reverting to child labor, getting workers to put in more hours per week, having 75 year olds work or invoking similar strategies that seem outside of current norms. Forty thousand new jobs a month is far lower than the 300,000 or so that were added on average in the past five years.
Adding 40,000 jobs a month doesn’t mean the unemployment rate will rise appreciably. The current rate of 4.2% is very close to the potential for the economy to support jobs without inflation, the so-called NAIRU rate, which is thought to be around 4.3%.
Don’t tell the politicians, but jobs prints like those in June-August could be about all that can be expected over the coming years.
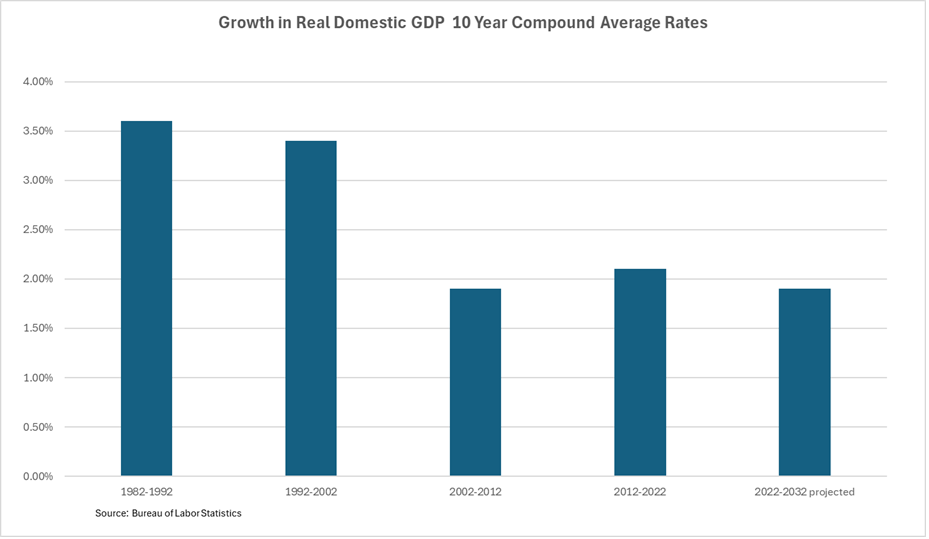
This might mean the outlook for economic growth is dampened. Or maybe not. Again, promise and reality may diverge. The CBO, Bureau of Labor Statistics and mainstream economic forecasting organizations foresee real GDP expanding at a rate of less than 2% over year over the next decade. (A link to the Congressional Budget Office analysis is here:https://www.cbo.gov/system/files/2025-01/51135-2025-01-Economic-Projections.xlsx)
This is not “recession,” and it may not really be “stagflation.” The two terms have come to have pollical overtones that discount their utility. It may just be the new normal.
That’s not to say that the Trump Administration promise of growth of three percent or more—a return to the level of the 1980s and 1990s–is impossible. That level of growth was driven by two factors: expansion of the labor force and strong growth in productivity.
The first ain’t going to happen. The natural demographic factors will slow the expansion of the labor force and the Administration’s immigration policy will further challenge the job market.
Outsized productivity gains are not impossible—at least not if you are a strong believer in the power of AI. But so far it’s promise and hype, with little reality to show.
Productivity data are compiled quarterly by the BLS. And a word of caution: productivity is not a short-range phenomenon. It depends on labor and capital inputs and resulting measures of economic output. So best to look at it over a term of years.
Productivity has averaged around 1.3% per year over the past 50 years. The internet/tech revolution of 1995-2008 boosted this to nearly 2%; since 2010 it has averaged about 1.5%.
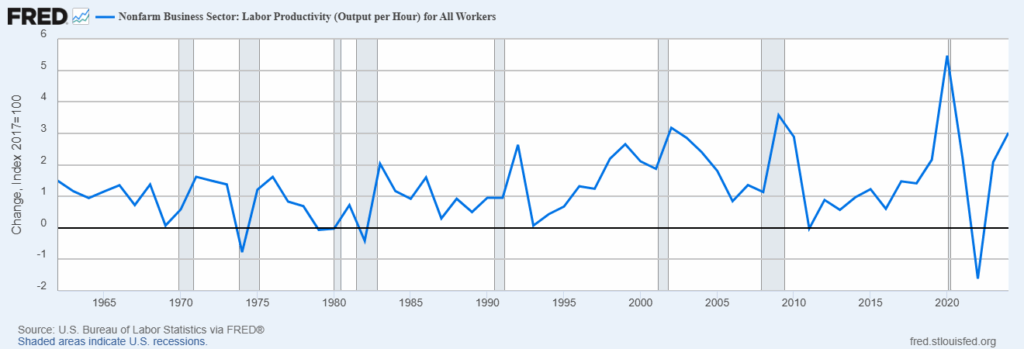
If productivity growth were to fuel a return to a period when real GDP expanded at better than 3% it would have to overcome the adverse trends in population and labor force. Possible, but that would be a tall order. (Another caution: The quarterly changes in the last five years or so were strongly impacted by the pandemic and recovery. It would be premature, or worse, to extrapolate the strong upward move in recent quarters until we see more data.) Could productivity expand at 2.5% or better over the next decade? Time will tell.
Bottom Line.
In a few words, there is a lot more to the monthly jobs report than meets the eye. Slower growth in jobs will translate into changes in sources of revenue for governments and the demographic changes will affect the type of services governments are called on to deliver. Markets will take time to accommodate these changes. Talking heads will have a lot to say about each month’s release, but not much to say about the long term implications.


