
Cliff Notes on the Upcoming Federal Open Market Committee Meeting
 Next week’s meeting of the Federal Open Market Committee is almost certain to set short-term interest rates firmly on the road to lower. That much is given. But it will also mark the debut of a new, more political Fed and provide important guidance for investors to assess the forward path of the U.S. (and global) economy.
With that in mind here are some cliff notes to help you follow the action.
Fed Funds—the Main Policy Rate
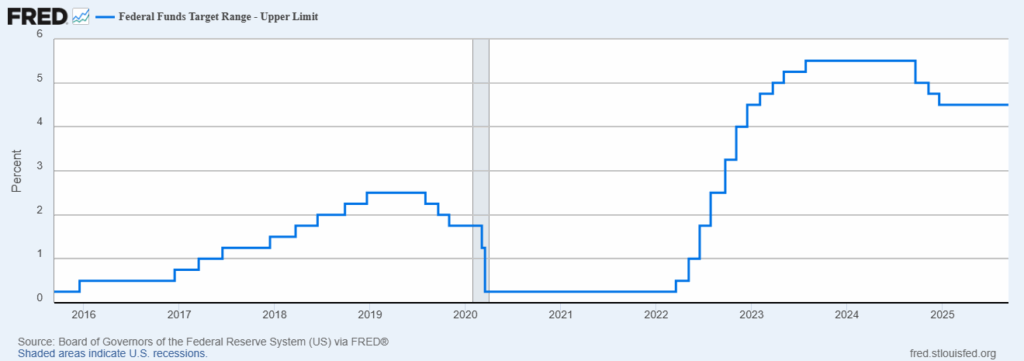
The federal funds rate, currently managed by the Fed to the range of 4.25% to 4.50%, is the central bank’s main policy tool. It has been at the current level about a year after the Fed cut it from 5.50%. That level was the highest in a generation, and up from just above zero (the so-called “zero bound”) in 2022.
The volume of federal funds traded is small, about $110 billion daily compared with daily money market volume more than $6 trillion, but this rate drives the short end of the market and signals the Fed’s intentions which can be enforced by setting rates on other instruments such as repurchase agreements. The Fed also may use its balance sheet to buy and sell securities to affect monetary policy but this is not a usual tool and don’t expect it to be in play at this point.
Employment and Inflation: The Fed’s [Dual] Mandate
By statute the Fed has three mandates, set by Congress in 1977: to pursue maximum employment and stable prices and to “moderate long-term interest rates. ” But the last gets almost no explicit attention from Fed policy makers , probably because they believe it is not something they can manage independently of employment and inflation. Hence the oft-used phrase “dual mandate.”
These days the employment mandate seems to get more attention but that has not always been so. As recently as 2023 some Republicans, notably former vice president Mike Pence, argued that Congress should repeal the employment mandate and have the Fed focus solely on managing inflation. But times change and the Trump Administration’s drive to grow gross domestic product by three percent or more annually has led him and his advisors to push for a low rate regime in the hope that it will drive growth and reduce the cost of financing the federal deficit. (See more on borrowing costs below.)
What is Maximum Employment?
You might look at a long-term chart of the unemployment rate and conclude that we’re not that far from maximizing employment. The average since the end of World War II has been 5.7%, compared with the current rate of 4.3%.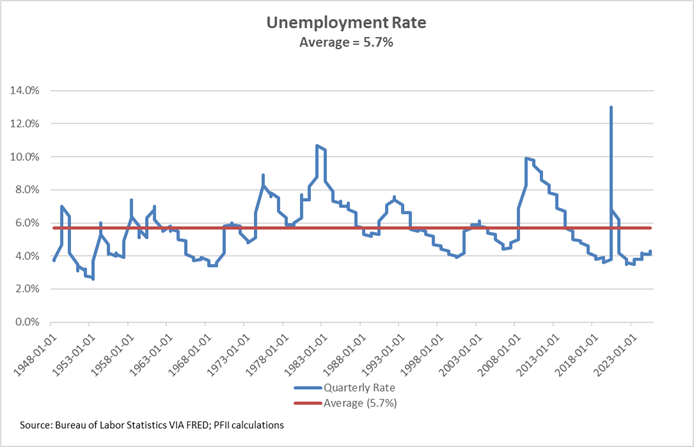
The Fed doesn’t have a specific goal for the unemployment rate, the number of jobs created in a period, or any other employment measures. Rather it’s kind of “we know it when we see it.” The best we have is its current Summary of Economic Projections. That shows a long-term expectation on the part of the board for the unemployment rate to be in the 3.5% to 4.5% range. In 2019, before the pandemic, this range was 4.0-4.4%. So, the Fed has raised the bar, so to speak, on maximum employment.
While there is no announced Fed goal for employment, economists have developed the concept of the Non-Accelerating Inflation Rate of Unemployment which some think should be the Fed’s goal. The Fed doesn’t officially recognize NAIRU as a goal and it’s theoretical so it cannot be calculated, but, for example, the Congressional Budget Office estimated NAIRU recently to be 4.4%.
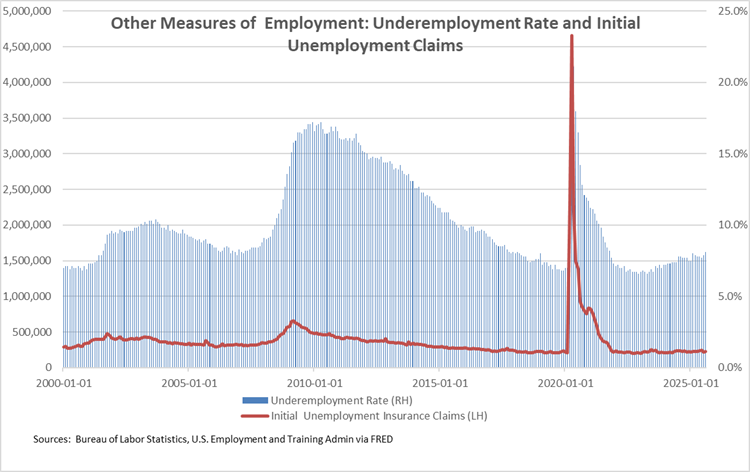
The unemployment rate and number of new jobs created in a period are not, in and of themselves, comprehensive measures of the health of the labor market, but they are useful implements (weapons?) for political discussions. There are more comprehensive measures of employment that include under-employment, employment-related earnings, hours worked, and duration of unemployment.
Try to expand jobs too quickly and economists believe that inflation will accelerate. Too slowly and willing workers will be out of work or under-employed with all of the attendant human and social costs that this entails.
Meanwhile, most labor market indicators point to a solid market that is showing signs of weakening.
How About Inflation?
The central bank does have a specific inflation target. It is 2% annual growth of Personal Consumption Expenditures. The most recent data show prices expanding at 2.6% year over year, down from a peak of more than 7% in 2022. Whether that is about right or too high depends on your outlook.
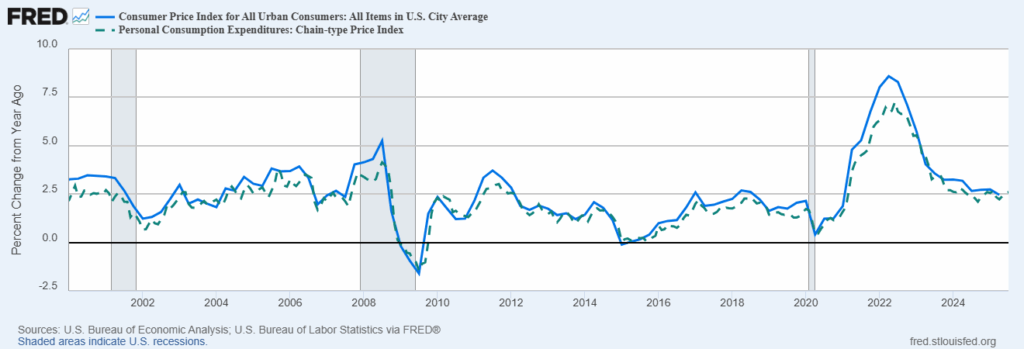
The PCE measure is not as popular with commentators and politicians as the Consumer Price Index, perhaps because its swings are less dramatic than those in CPI, but over time the two measures show consistent trends.
Why a 2% target? There is no rigorous analysis to support this goal. It originated with the New Zealand Central Bank (!) in 1990 and gradually was adopted by other monetary authorities.
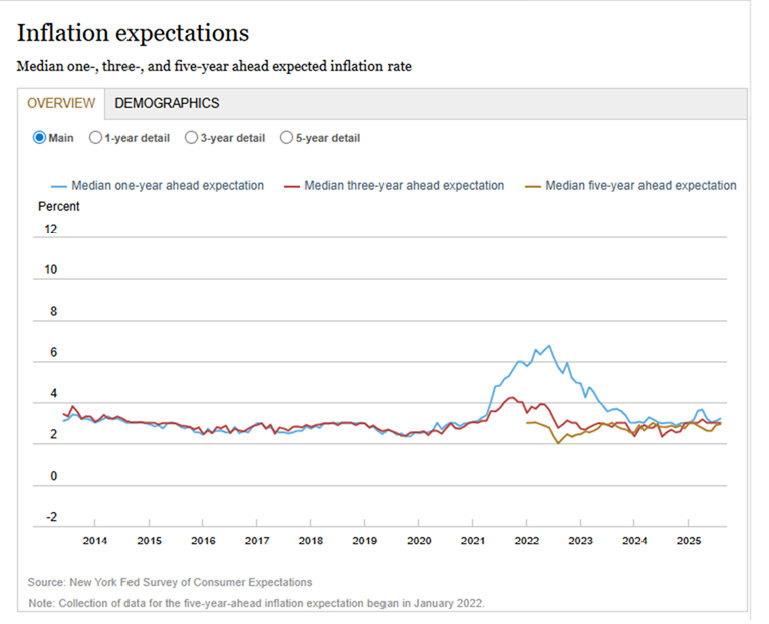
The PCE Index measures past price movements but most economists would say that a more important measure is inflation expectations because they relate to future activities like spending and saving. They are much more stable than the spot price index. During the recent period of heightened price movements the Fed’s survey of consumer expectations rose but it has since returned to its prior level.
While we’re on the topic one might ask whether, in the long term, an economy with 2.5% (or 1.5%) inflation will perform very differently than one with 2%. So perhaps rather than focusing so strongly on a figure—2%, with its unusual lineage—”low and stable” should be the goal.
Does the Fed Consider the Cost of Borrowing?
The Fed treads lightly here. Its third mandate, to seek to moderate long-term interest rates, is rarely discussed or even referred to in FOMC minutes and statements, though it is immensely important for the economy as the foundation for government, corporate and household borrowing.
President Trump has practically shouted from the White House portico that if the Fed were to reduce rates to 1% taxpayers would save $1 trillion a year in government borrowing costs, but mainstream economists fear that this would lead to a regime of “financial repression” where free market activities are constrained in favor of funding the government, (favored examples are Zimbabwe or Turkey.) leading to a collapse in the currency and run-away inflation.
Forward Guidance: Read Our Lips
In the 1970s the Fed’s monetary policy was a kind of state secret. Each day its open market trading operation would enter the repurchase agreement market and investors would try to discern from its buying and selling whether it was trying to move short-term rates up or down.
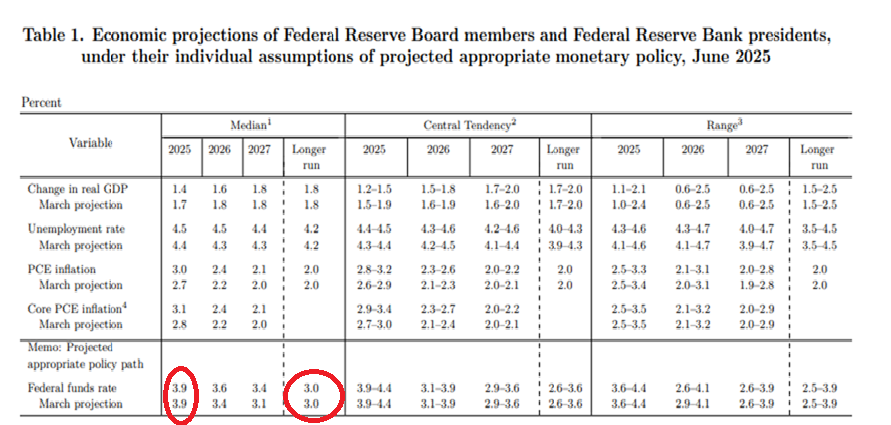
These days we have post-meeting announcements, the chair’s press conferences and the quarterly Summary of Economic Projections. The new SEP, to be released at next week’s meeting, will be parsed for changes in the board’s outlook for gross domestic product, the unemployment rate, inflation and the federal funds rate. Look for changes in the near-term projection for federal funds (for 2025 in the SEP) to signal any change in the pace of additional cuts this year (the current SEP implies two of 25 basis points), and changes in the longer-term level to signal a change to the terminal rate (currently 3.0%). Here is a picture of the table in the SEP that get’s attention:
The Outlook for Rates
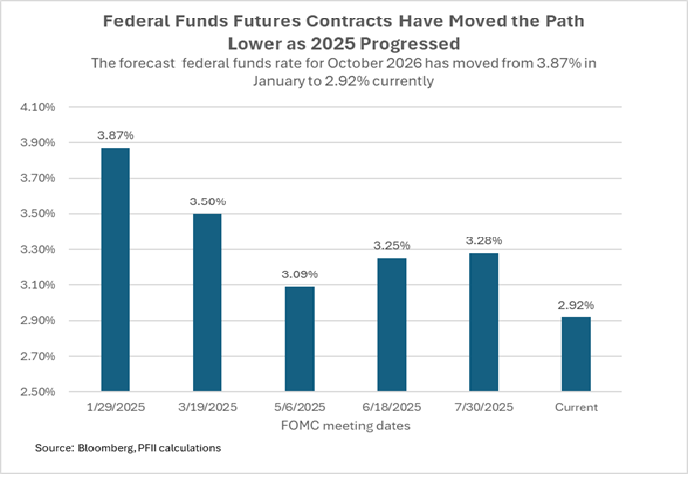
The market outlook for the future path of overnight rates has moved lower since the beginning of the year with futures contracts as of September 10 indicating a rate of 2.92% next September.
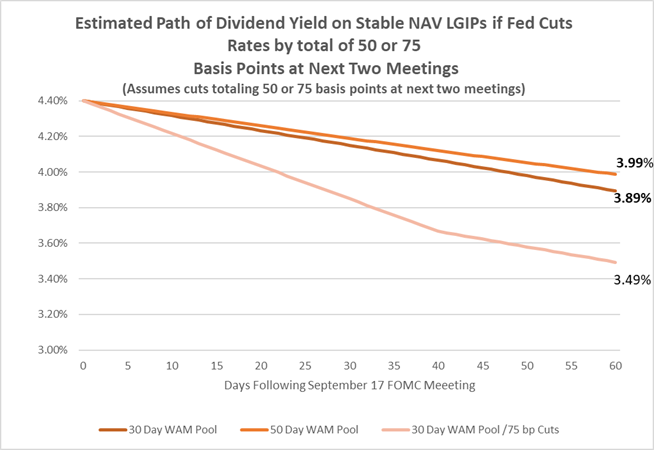
if the Fed follows the path that now sems likely local government investment pool (LGIP) rates, which are are closely correlated to the federal funds rate, will decline dramatically from their current level of about 4.40% (for prime LGIPs). LGIP yields generally lag changes in the policy rate by 30 to 60 days, but except for yields on some state-sponsored LGIPs (California’s Local Agency Investment Fund comes to mind) they will fall below 4% in the next two months and be in the low 3% range next spring. Our LGIP portfolio model forecasts these rates over the next 60 days and the chart below shows the central tendency for a prime LGIP. A step up to 50 basis points next week, followed by 25 basis points at the following meeting would accelerate this and also bring into consideration whether the central bank will stop at 3%.
Other short-term rates are also affected by Fed policy. The yield on the two-year Treasury moved from nearly 4.40% for a brief time in January to its current level of 3.51%. The 10-year Treasury yield is now about 4.07%. compared with the 4.25%-4.50% federal funds rate. (Both rates as of September 10.)
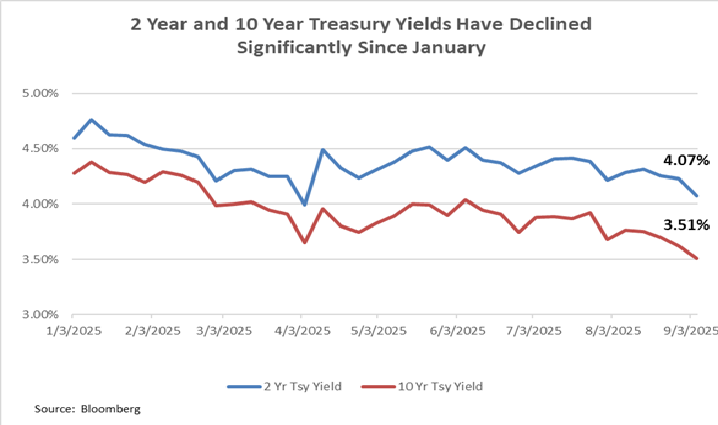
The yield on the two-year Treasury is a good measure of the investment environment for public funds investors. Where 5% plus was achievable as recently as 18 months ago if the Fed pursues a pace of moderate easing (say 25 basis points at each upcoming meeting), the level is likely to be close to 3% by next spring
Rates on longer-tenor securities have moved lower as well this year. Investors in long-maturity securities have an eye on short term funding rates but also care about inflation and growth expectations over time, market risk, the value of the U.S. dollar and supply of investments, so these rates do not move in lock step with changes in Fed monetary policy. That they have followed the lead of the Fed to date indicates that investors retain faith that the Fed is in step. If that changes, we could see a divergence between long-tenor and money market yields.


