
Recap of 2025: The Benefit, and Limits, of Hindsight
 Hindsight is (usually) 20:20. With that in mind here’s a recap of how public funds investment strategies performed in 2025.
• Longer was better, with a modest decline in interest rates boosting returns of public agency portfolios invested beyond the cash space and dragging down the returns of local government investment pools and money market funds.
• For example, the PFII model 1-3 year portfolio returned 5.22%, nearly 100 basis points more than stable value LGIP returns. A longer-duration portfolio that was invested out to five years returned more than 6%.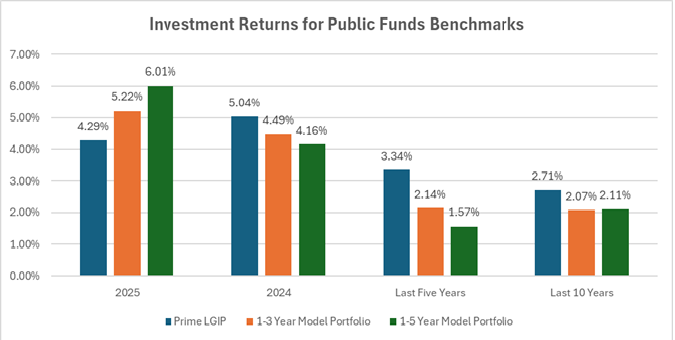
• These model portfolios relied on a hefty allocation to credit for their results. Thirty percent of the model portfolios invested in A or better rated corporate bonds contributed 20 basis points to the overall return of the 1-3 year model portfolio and 26 basis points to the 1-5 year portfolio.
• While “longer is better” applied in 2025, over the last five years longer-duration portfolios and benchmarks under-performed the LGIP measure. Over five years the underperformance was 177 basis points (compared to 1-5 year portfolio) and 120 basis points (for the 1-3 year portfolio).
• It’s not just the sharp move in rates in the current Fed tightening cycle. Going back 10 years the LGIP measure bested the longer-duration model portfolios by 64 and 60 basis points for the 1-3 year and 1-5 year benchmarks respectively.
• Basis points are real money. The difference in returns on a $10 million portfolio is more than $650,000 when comparing the LGIP return to that of the 1-3 year benchmark over the 10-year period.
• The important message here is not which portfolio maturity position had the best return in a given period, but that managing a portfolio to capture the best yield/return at any given time requires timing the market, something that is notoriously difficult.
Treasurers and portfolio managers would do well to skip the bragging rights over the highest return for a particular period and focus instead on cash needs and risk tolerance over the longer term.
Deep Dive
It should not be surprising that returns for portfolios invested beyond the very short maturities of stable value LGIPs produced superior returns in 2025. To simplify the reason, they benefitted from securities whose yields were fixed in a declining interest rate environment. As the Federal Reserve lowered its main policy rate these securities (unless they were callable or floating rate securities) maintained their yields until they matured and also appreciated in value. Through the year, as securities matured and were replaced, the portfolio yield would have declined so that by year end its yield would have dropped by about 75 basis points, but it also benefitted from market-related gains in the value of its holdings.
The model 1-3 year portfolio consists of 60% Treasuries, 30% investment grade corporates and 10% in a proxy for a stable value LGIP. The Treasury component of this portfolio returned 5.07% in 2024. Diversifying the portfolio into corporates increased the return because that component returned 5.86%. Of course, this added return comes with increased risk and lower liquidity, so we limited it to 30% of the overall portfolio. The LGIP proxy returned 4.20% last year. We invested 10% of the assets in the LGIP to provide for liquidity.
Extending the maximum maturity of the portfolio to five years improved the overall return by about 80 basis points. Much of this boost came from the corporate allocation since longer-maturity corporate bonds command a bigger premium over Treasuries, but some boost also came from the longer duration of the overall portfolio. That raised the market value gain in holdings.
There are a lot of moving parts to these results, and to achieve them one would have to be right on the overall maturity structure of the portfolio, the allocation to corporate bonds and the specific corporate bonds that replicated the risk and return in the models.
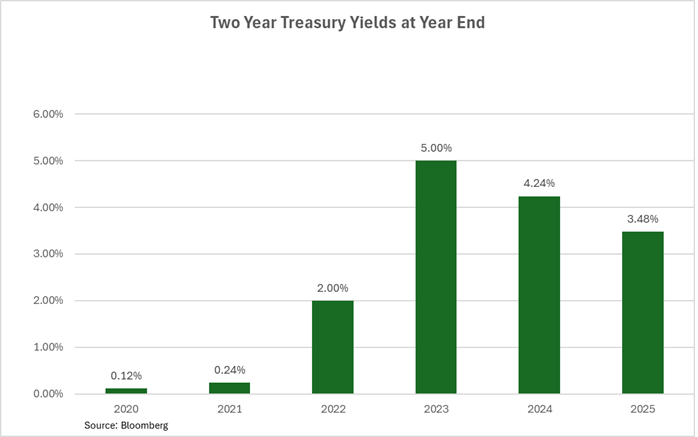
The sharp rise in interest rates over the past five years, from slightly above zero in 2020 to a peak of more than 5% in late 2023, followed by a decline to about 3.50% at the end of 2025 put public sector investment strategies to the test.
If you were chasing yield/return in 2020 you likely had locked in portfolio returns of less than 50 basis points for the next couple of years. Your portfolio might have looked well-positioned for a time when LGIP yields were in the range of 15 basis points, but by the end of 2022 your yield was unlikely to be higher than 1% and you would have incurred significant unrealized losses to be recorded on your financial statement.
Looking back at 2025 it may seem obvious that a portfolio structure like that of the models would be beneficial over the year. But (obviously?) when interest rates rise such a structure will underperform a short-term liquid LGIP.
Indeed, over the period 2020-2025 the LGIP proxy returned 3.34% while the model 1-3 year portfolio returned 2.14% and the 1-5 model returned 1.57%. Over a 10 year horizon a benchmark representing a portfolio of Treasuries and investment grade corporate bonds with a three year maximum maturity returned 2.07% compared to the LGIP proxy of 2.71%.
Lazy Cash?
Those who use an LGIP as the main vehicle for investing are sometimes said to have “lazy cash” that they should put to work in a portfolio of securities or interest bearing deposits (and perhaps hire an outside advisor?) to improve results.
But the 2020 hindsight view challenges this. No doubt there are times when an LGIP will outperform and times when a fixed maturity portfolio (with maximum maturity of three or five years and an allocation to corporate bonds) will do better. But picking the right times and right structure for a portfolio with the objective of improving/maximizing return over time requires a manager to time the markets right twice in a cycle, once to “go long” and again to “go short.” Those portfolio managers who can do so are a rare breed and, as Bill Gross of PIMCO did, can become billionaires.
Bottom Line
Point-in-time analyses that lead to deploying or re-deploying cash to take advantage of market opportunities can pay dividends, but they also have a cost because they give up liquidity and lock in yield.
Strategies built around using a stable value LGIP may produce more income volatility, but the return will always reflect current interest rates, extra income can be put into a reserve or rainy day fund to be used to normalize budget impact, and there should be no unrealized losses to book. Fixed rate portfolios may provide more certainty as to income over multiple years but expose the possibility of ugly unrealized loss issues. The prime example of this is the strategy of investing construction funds to meet project costs over time.
Is it not too bold to say that implementing a portfolio strategy that seeks to maximize return should not be the charge of public funds investors? Portfolio managers/treasurers should consider the cost or value of liquidity and the cost or value of fixing interest income over a muti month (or year) period. Hindsight may be 20:20 but that is of limited help in plotting the best way forward.
_____
A note on sources and methods: The PFII 1-3 year model portfolio consists of Treasury, investment grade and corporate bond ETFs and a government money market fund. It is rebalanced monthly and returns are calculated using the Bloomberg Port function. Monthly returns and portfolio characteristics are displayed in the Investment Dashboard section of the website. Its results are available for 2024 and 2025. The returns and portfolio characteristics for the 1-5 year model portfolio and for the five- and 10-year periods were calculated using relevant ICE BofA benchmarks and a prime money market fund as a proxy.


