
First Quarter Investment Returns: Lessons Learned

It was not supposed to be this way. At the start of 2026, many investors were looking forward to declining short-term rates, with the Federal Reserve continuing to cut the federal funds rate to three percent by year-end. Some prominent economists forecast rates with a two percent handle by December. Longer-maturity investments, including two-year Treasuries with yields around 3.50%, seemed to have value.

But March was a cruel month for bonds, with interest rates jumping by 40-50 basis points. Short-term bonds lost a lot of value, with the two-year Treasury note shedding three-quarters of a percent in the month. For five-year Treasuries, the loss was more like two percent.
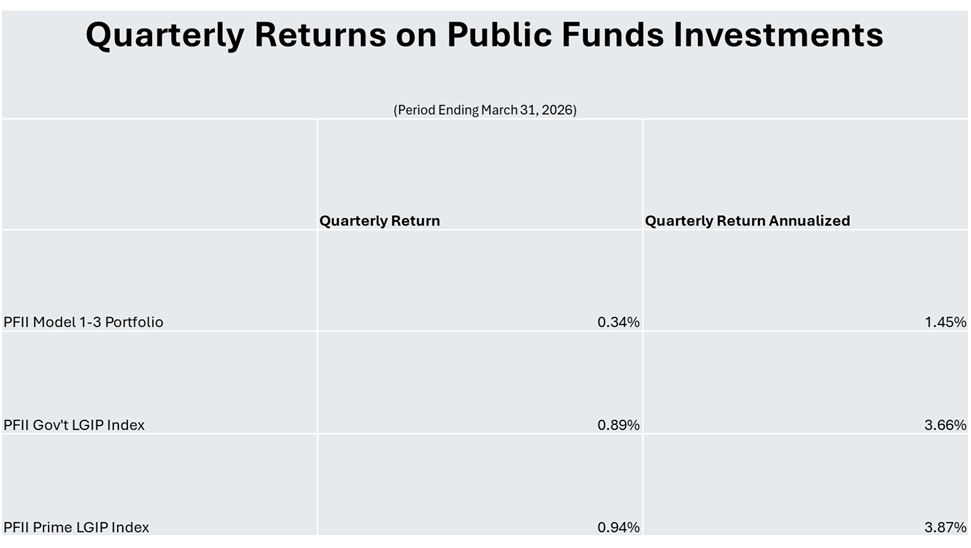
For the quarter, returns on many public funds portfolios were in the range of 0.15% to 0.30%, equating to annual rates of 0.8-1.25%. Our 1–3-year model portfolio, which consists of 60% Treasuries, 30% corporate bonds and 10% cash equivalents, returned 0.34% for the quarter (annualized to 1.45%). Results were far behind returns on local government investment pools (and money market funds). The yield on the PFII Prime LGIP index averaged 3.81% and the comparable annual yield, adjusting for compounding, was 3.87%.
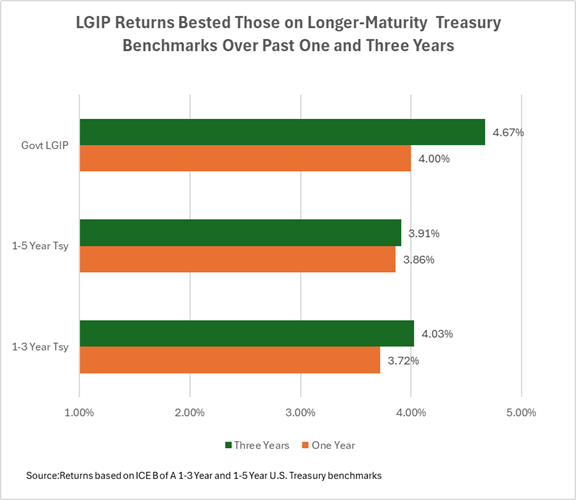
Portfolios with a profile like that of many public agency portfolios had their worst quarterly returns since 2024 and the result dragged down cumulative returns over longer periods. As the below chart shows, returns over one and three years for common public funds investment strategy lagged cash/pool investments.
Why It Matters
Investment income has grown to be a significant component of revenue for many states and localities. Accounting rules require that the income includes fair value adjustments, so returns, which include unrealized gains and losses, do matter.
Two investment strategies may result in the same income over time but may have different impacts on a public agency’s budget. Let’s say strategy one produced income that averaged 3.50% per year for three years—a total of 10.50%. If its investments are limited to LGIPs there likely would be no fair value adjustment in any year. Say strategy two produced income of 11% over this period but because it holds investments with longer maturities the fair value adjustment reduces income in the first year to one percent and to 3% in year 2 and increases it in year three to 7%. A portfolio manager could be satisfied with the 11% “return” over three years, but the budget managers might have a different view. That’s why managing public funds successfully requires a full understanding of your (“client’s”?) objectives.
The details
Longer Has Not Been Better. Longer-duration portfolios have not fared as well as cash/pool investments in recent years and the past year was no exception. While there are months or quarters where longer-duration portfolios have out-performed cash, this general “rule” is not always so. In the first quarter of this year, Treasury benchmarks with maturities of one to three years returned 0.29% (1.19% on an annual basis). Benchmarks with maturities up to five years did worse, with returns of 0.20%. This compares with a return of .89% for the PFII Government index.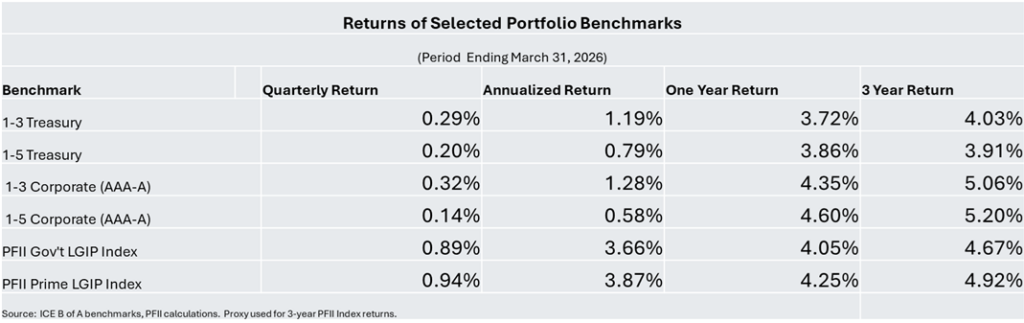
For one- and three-year periods the annual return of benchmarks with three- and five-year maximum maturities also lagged that of the Government LGIP index.
Some may say that cash invested in an LGIP can be characterized as “lazy,” but liquidity has not had a cost in recent periods.
Corporate Bonds Fared Relatively Well in the Quarter. Returns for benchmarks representing investment grade (AAA-A) corporate bonds did slightly better than their Treasury counterparts in the quarter, earning enough additional income to offset the effects of widening interest rate spreads. The returns for the Treasury and corporate bond segments of our model portfolio were both 0.28% in the quarter (annualized to 1.15%). The yield to maturity of the corporate bond holdings was 54 basis points at the start of the quarter. Worries about a weakening credit market led the spread to widen by 17 basis points in the quarter, depressing the value of the corporate holdings but the extra yield earned in the quarter just about offset the effect of spread-widening.
Reminder to self: extra income earned on an investment can cushion changes in fair value—up to a point.
The Story Could Have been Different
It’s easier to analyze the result of an investment strategy after the fact than to forecast results. If inflation continued to moderate, the labor market had weakened further, and the oil price surge had not taken place the Fed might have cut the overnight rate at its March meeting and might be prepared to cut again this month or in June. Two-year Treasuries could have rallied in price to reflect this. Their income, which started the year at 3.50%, would persist while yields on cash-type investments could decline to or below 3%.
Return comparisons are interesting, even fundamental to managing portfolios, but they don’t provide a lot of guidance when it comes to setting portfolio objectives. For this one needs a good handle on liquidity needs and risk tolerance (“Can I explain unrealized gains and losses to my audience?”).


