
Iran War: What to Watch
You don’t need extensive data analysis to know that the Iran War has become the force behind every tick in the financial market. Indeed, data can overwhelm to the point where it is difficult to discern reality.
What to follow? Below are four factors that I’m focused on, with charts that you can find or create and follow on the internet with (near) real time data, so you do not need a Bloomberg terminal. These themes define the big picture, if not all the (important) details. If you’re experimenting with artificial intelligence, you also likely can have one of the AI tools to build a dashboard for you.
Oil prices
Oil is first because supply is essential to the global economy and prices directly affect cost of living and cost of producing goods and services. Oil prices vary by quality and delivery point. I have habitually followed West Texas Intermediate (WTI) because it directly relates to U.S. oil supply/demand, but Brent is more sensitive to global/Middle East factors. The below chart is for Brent.
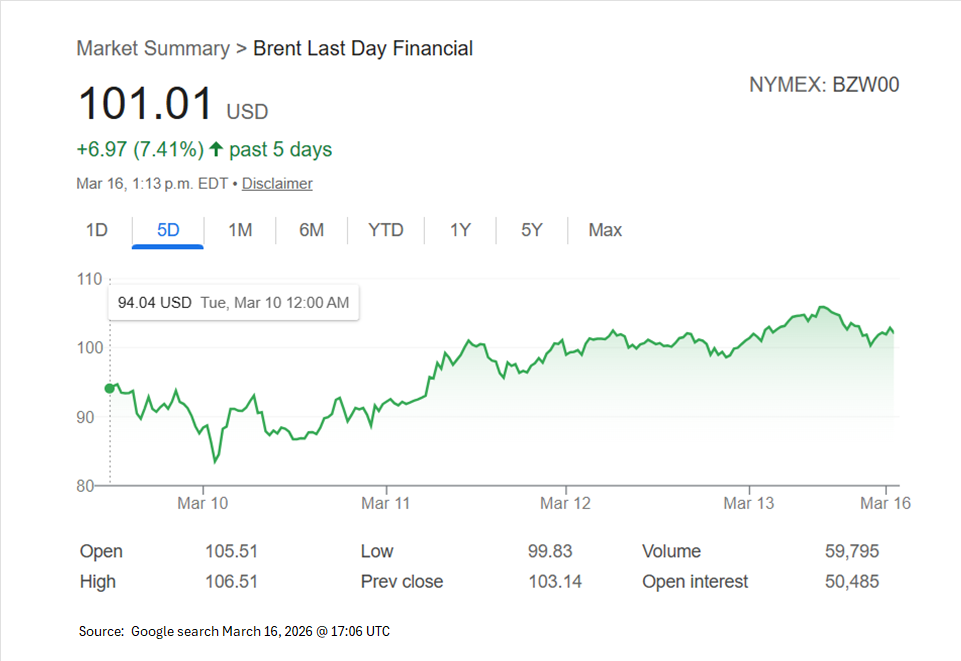
Regardless, oil is up A LOT. As recently as mid-December WTI was at about $56 a barrel. At this writing it is flirting with $100. The price of oil will metastasize into higher pump prices for gas and higher prices for other energy (natural gas, electricity) and ultimately will boost inflation, and it is inflation that will affect the macro economy and central bank policy.
Oil is a just-in-time commodity, that’s why the daily movement of price and supply are so important. To wit: the U.S. has is a net exporter of oil. That doesn’t insulate us from the global oil market. Nor does the 415 million barrel U.S. strategic petroleum reserve which is only about three weeks of domestic consumption. “Drill baby drill” may sound good but it would take years before new production could have an impact.
Oil prices have direct and indirect effects on inflation and some of the effects take time to bite. From last week’s issue here is a chart on the effect of a $20 increase in oil prices on inflation as measured by the Consumer Price Index.
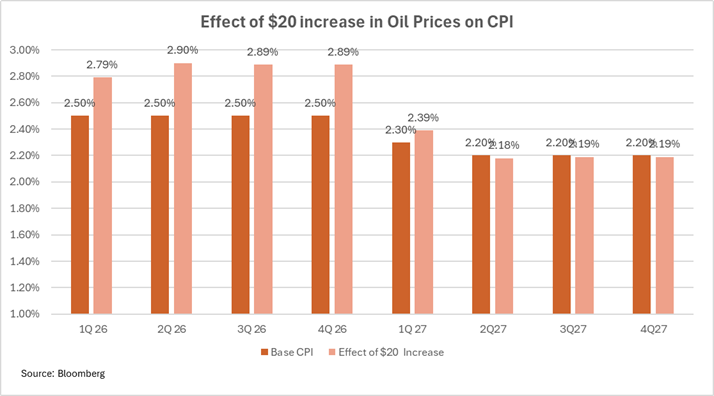 Inflation measures are bound to move higher in coming weeks, giving the Federal Reserve reason to refrain from cutting rates unless forced to do so by a collapse in the job market.
A few free websites track oil prices on a real time intraday basis. Google to find one. For a view on how they immediately affect consumers look to the AAA website site for retail U.S. gas and diesel prices, updated daily on a state-by-state basis.
Credit
Oil is center stage but don’t lose sight of credit. Cracks appeared in the credit markets last fall, and the War will increase stress. The current focus is on private credit, and public agencies are unlikely to have any direct exposure to this market, but I am watching to see how much of this spills over to the public markets and specifically to investment grade credit. I’m particularly focused on financial intermediaries—banks and bank-like financial organizations whose business involves broader financial markets.
Credit spreads are fundamental to observing this risk. Until the beginning of last month the spread—or additional yield—investors demanded to invest in investment grade corporate bonds vs. Treasuries was at historically low levels.
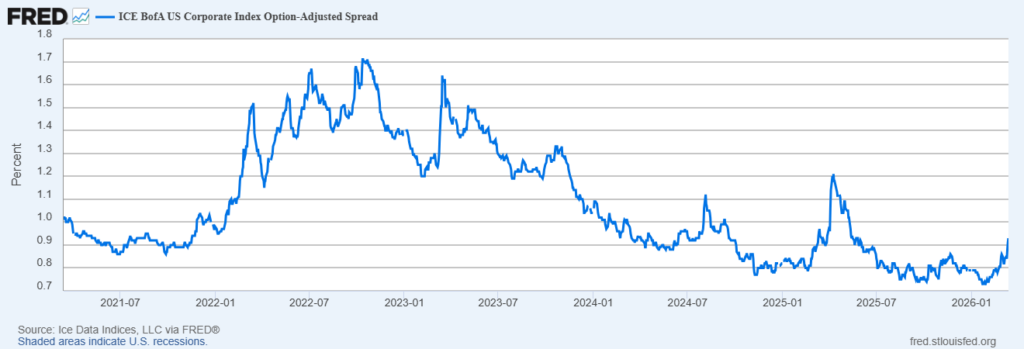
The accompanying chart shows an index of the difference in yields between corporate bonds and comparable Treasuries.
It is now around 90 basis points, up from a historically low spread of nearly 70 basis points but still much below the level experienced after Trump announced his Liberation Day tariffs last April and a level of 400(!) basis points during the Covid-related market disruption.
You can monitor the investment grade corporate bond spread by accessing the above chart on FRED. It is updated daily. You can also monitor the intra-day tick by tick price for LQD, an ETF sponsored by BlackRock, which is designed to track a broad index of investment grade corporate bonds. Because it trades actively during the day it is a high frequency indicator whose price will reflect the current state of the investment-grade corporate bond market. But keep in mind that LQD prices factor both risk-free rates and spreads so you need to compare its movements with those of a risk-free investment like the 10-year Treasury.
10 Year Treasury Yield
Few public agencies invest for 10 years, but I view the yield on the 10-year Treasury as the best single measure of the overall heath/direction of the fixed income markets. It factors an inflation outlook, market liquidity, the health of the short-term repurchase agreement market and the potential for Treasury borrowing. As the accompanying chart The 10-year Treasury yield has risen modestly since the War started.
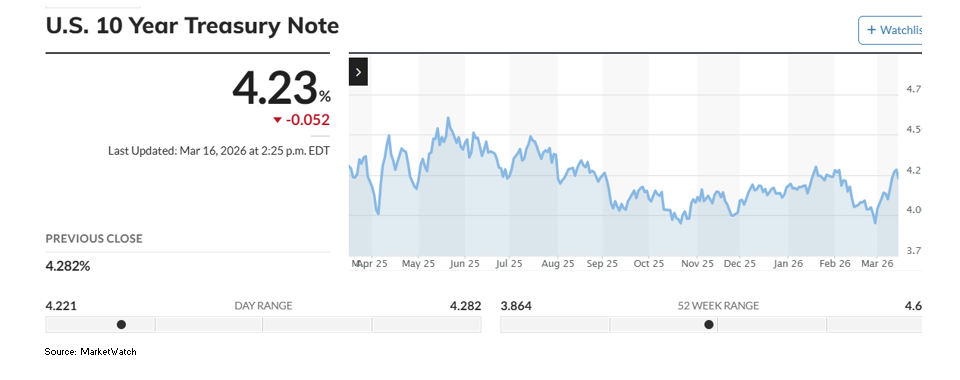
If you believe that the U.S. economy is on a good path to solid growth, diminishing inflation and a well-managed fiscal and monetary policy the yield on the 10-year Treasury should be about 3 %. (“I’ll pay you 2% to cover inflation going forward plus something for you to forego liquidity and a bit for your trouble. This is risk-free. Let’s call it a deal at 3%.”) Instead, its above 4%, where it’s been stuck for months, and it has risen by about 20 basis points since the War began.
Intra-day and historic yield information is available from a few financial news sites without cost, and it is close to real-time.
The Value of the Dollar
The Iran War is the latest, but not the only, Trump Administration move that has potential to disrupt the global order, creating winner and loser nations. In the first year of the administration the U.S. Dollar lost about 14% of its value, but in the first two weeks of the War it has gained back about 4%.
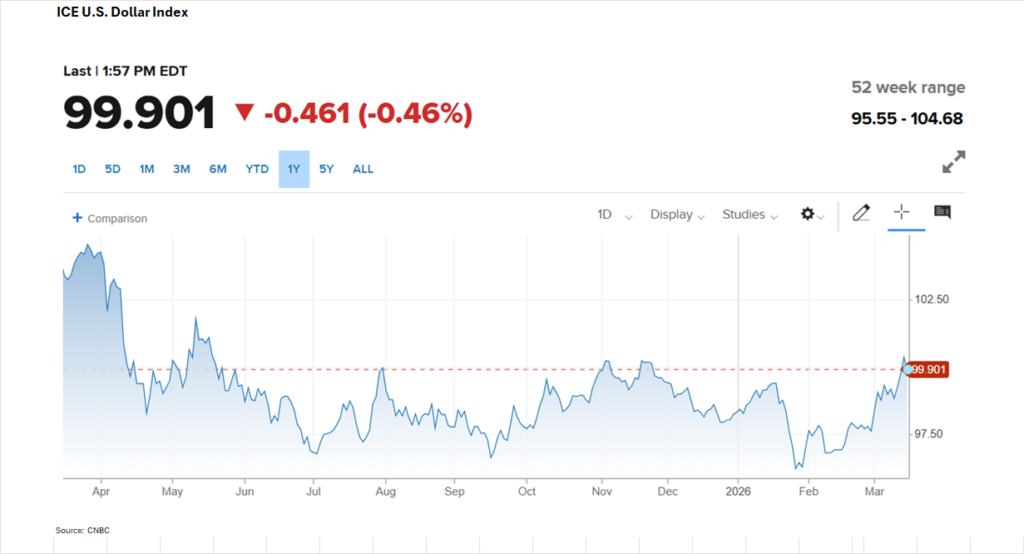
The value of the dollar directly affects the costs of imported and exported goods and services, the value of earnings from offshore business of U.S. based companies, and the relative attractiveness of investing in U.S. dollar-denominated stock and bonds, so it’s fundamental to the workings of the economy and markets.
Oil is traded globally largely in dollars and the run-up in oil prices means that oil consumer currencies will be under pressure as they are sold to acquire dollars to pay for petroleum.
Managing currency value is the responsibility of the Treasury, but the Fed is responsible for maintaining dollar liquidity in foreign markets. Stresses in the currency market can lead to central bank action, for example by raising rates (or keeping rates high) at a time of dollar weaking or reducing them to dampen dollar strength.
You can monitor DXY, a daily index of the value of the dollar against a basket of major currencies, via a few sites with near real-time results. Simply Google for the URLs.
Bottom Line
Investment rates available to public agencies closely track rates on federal funds and a related measure, the Secured Overnight Funding Rate. This is true for rates on LGIPs, short term Treasuries, commercial paper, and bank deposits.
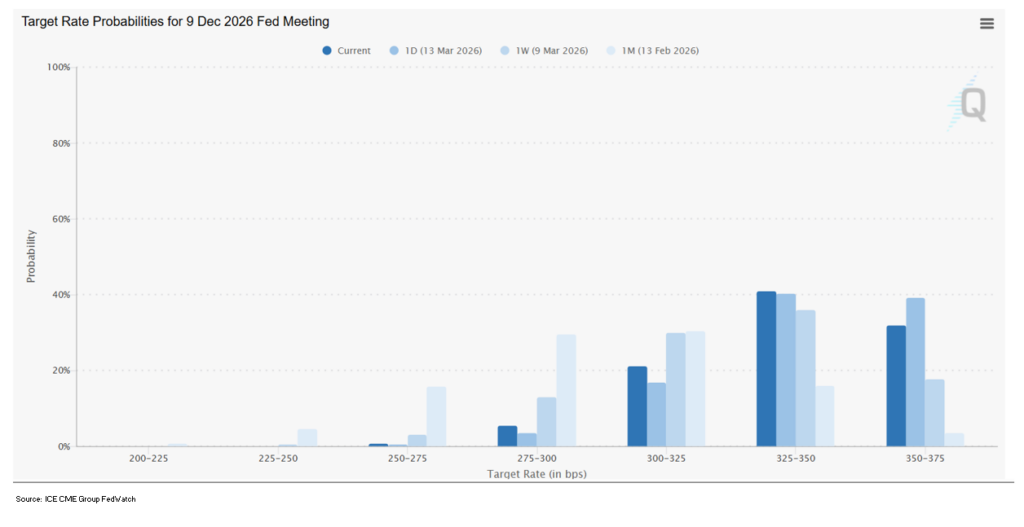
The accompanying chart, provided by CME Exchange, tracks changes in the outlook for federal funds.
The sharp rise in oil prices and Bureau of Economic Analysis release last week of worrisome personal consumption expenditures data for January led investors to revise their outlooks for federal funds to favor no change (33%) or one cut (41%) to 3.25% by year-end. This is a big change from a month earlier when the markets showed a probability of two cuts (30%) or three cuts (30%) by year end.
The War complicates the Fed’s effort to manage inflation and maximize employment because so much is unknown about the near-term path for the economy. Data dependence, which has been a critical element in the central bank’s monetary policy determinations recently, can only grow in importance with the uncertainty brought on by the War.
The CME Group, the exchange where futures contracts are traded, has an interactive tool that presents the probability of changes in the Fed funds rate at upcoming Federal Open Market Committee meetings. It is updated multiple times each day. You can access it here. You can select the date of a future FOMC meeting to see what the current probabilities are for a change in the federal funds rate as calculated by trading in federal funds futures contracts.


