
Public Sector investment Assets: Stability and Liquidity Prevail
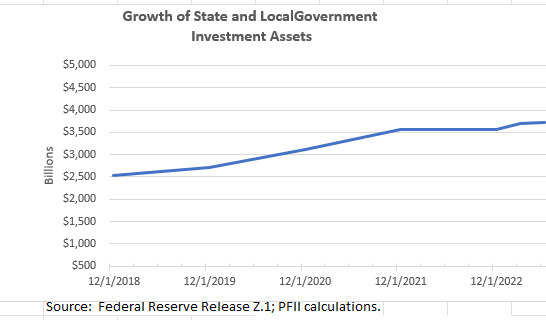
Investment assets of state and local governments have grown slowly in recent quarters despite a sharp rise in interest rates that adds income to portfolios at the highest rate in more than a decade. A Federal Reserve report, released last week, showed public sector investment assets at $3.7 trillion, almost unchanged from the level reported for March 31. Actual figures: June 30 – $3.724 trillion, March 31: $3.696 trillion. The change? 0.7%.
This contrasted with growth of 2.7% in overall financial assets for US households, businesses, and other organizations for the same period.
The below chart plots the trend in levels of state and local government investment assets (excluding pension/retirement assets). Strong growth in the years 2019-2021 has been followed by a leveling more recently.
Slow growth comes despite a sharp increase in investment rates and portfolio income that would boost asset levels.
What’s behind the trend? Asset trends reflect four factors:
- Higher interest rates. With the sharp rise in investment rates since the start of 2022 financial assets should accumulate income at a healthy pace. This contrasts with virtually no income-based asset accumulation in 2020-2021 when rates were barely above zero.
- State and local revenue collections. Census data show that state and local government tax collections have declined from a peak early in 2022 and have stagnated in recent quarters. This is illustrated in the following chart. This decline in revenue collections comes despite continued expansion of the economy and solid growth in household net worth and spending—the basis for most state and local taxes. Combined net worth for all sectors of the US economy grew 5.4% in the first six months of the year but the growth has not extended to state and local government revenue

.
- Federal payments to states and localities. COVID-19 brought huge Federal relief payments to state and local governments in 2020 and 2021. Federal payments to states and localities, shown in the chart below, have now returned to normal trends.

- Spending. Spending by state and local governments remains robust, growing 4.6% in the first half of this year, according to Bureau of Economic Analysis data Even in the absence of a recession—which looks less likely today than it did six months ago—demands to fill gaps in the social safety net, fund infrastructure and deal with immigration stresses remain strong.
The simple math is that investment portfolio earnings–now at a level reflecting the sharp surge in interest rates–has been barely enough to maintain investment portfolio balances in the face of a fall-off in state and local tax receipts, the end of the Covid-related Federal relief programs, and ongoing spending.
Overall public sector investment balances are likely to be pressured lower in coming quarters despite portfolio earnings that should generate income at an annual rate more than 5%.
These are overall national trends and individual circumstances will vary, but from this perspective what might otherwise offer a boost in overall state and local government resources from the highest investment rates in more than 15 years is more likely to be simply an offset to other factors that will continue to pressure portfolio balances.
Portfolio quality has improved. Meanwhile Fed data document that public funds investment portfolios have improved their already-strong investment quality and liquidity and are better positioned now to withstand financial market uncertainties.
The following chart summarizes changes in the composition of state and local government investment portfolios for the period 2018-2023

Holdings of Treasury securities continue to grow and represented 44% of overall investment assets at the end of the quarter. This continues a trend, as Treasuries

represented 36% of investment holdings at the end of 2020. Federal agency holdings have declined over the past several years as the GSEs shrink their debt issuance, but this has been offset by an increase in Treasury holdings. Treasuries, Federal agency securities and repurchase agreements combined totaled 61% of investment assets as of June 30. This compares with 56% in 2020. The net effect has been to improve overall asset quality of portfolios.
The risk profile of investment assets is strong. The total of government obligations and money market fund assets was 63% as of June 30. (We believe that most of the money fund assets are in government or Treasury funds.) This is up from 58% in 2020. These assets have low market risk, even in a stressed market.
Bank deposits totaled 19% of investment assets. This is about the same level as deposits at the end of 2022. In contrast, deposits from households, businesses and other organizations declined about 2% this year, perhaps in response to the bank stresses and low bank deposit interest rates, but the data indicate that state and local governments did not react strongly to these factors. Public funds investors also maintained about 50% of their bank deposits in cash or checkable accounts. For the broader deposit base only about 23% of bank deposits were in such accounts at quarter-end.
Investment liquidity. Overall, assuming the low-risk assets (61%) are liquid and adding the checkable bank deposits, 72% of portfolio assets were liquid as of June 30. This is up from a combined 61% in the pre-COVID year 2019. That is a remarkably high ratio, perhaps because of cash flow uncertainty, or perhaps indicating the potential to deploy excess liquidity to improve earnings.
The Bottom line—investment portfolio holdings are remarkably stable. Neither sharply higher interest rates nor an increase in the yield premium available in high quality credit instruments has resulted in a shift in assets to higher-yielding sectors. It appears that financial market dynamics have had limited influence on public sector investment strategies. The facts may be different in individual investment portfolios but overall the result may represent a limited response to market opportunities. Statutory and investment policy limits, limited investment resources or strong emphasis on uncertainty with regard to spending-down balances all may play a role.
Benchmarking individual portfolios. The quarterly Fed data provide a basis for benchmarking individual public agency portfolios. Asset trends, portfolio composition and liquidity analysis, when compiled over a period of months/quarters can provide insights into portfolio risk and investment opportunity.


