
State and Local Government Investment Assets Show Growth Despite Economic and Fiscal Uncertainty
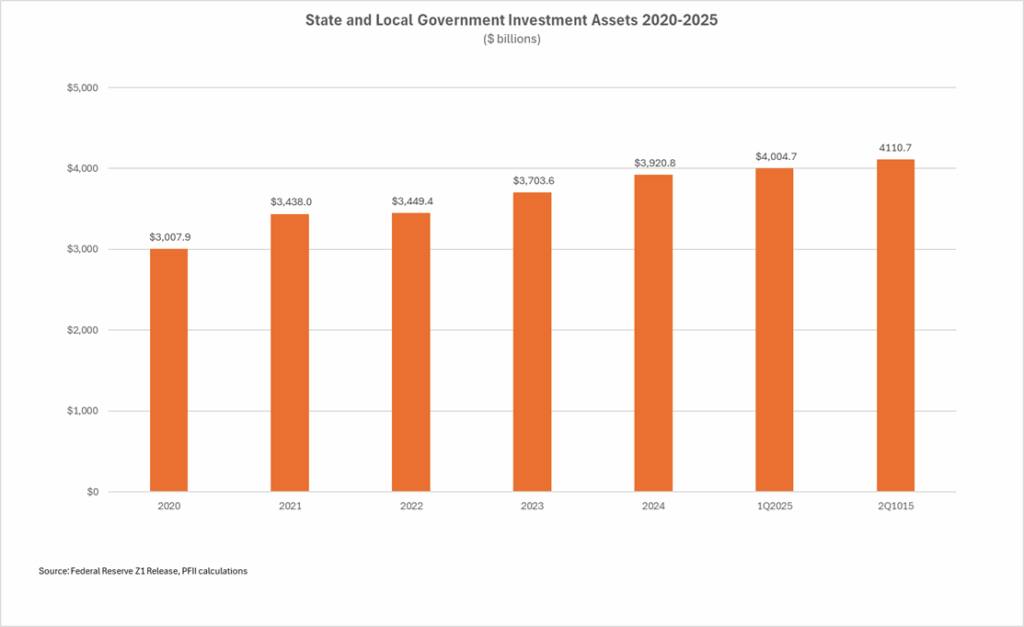 State and local government investment assets grew by $110 billion, to $4.1 trillion in the second quarter of 2025, a surprisingly strong pace given the high level of economic and political uncertainty.
• The growth of three percent in the quarter and eight percent in the 12-month period extends a trend of expanding investment assets that has been fueled by a surge in interest income, a large expansion of post-Covid federal aid and solid revenue collections.
• Will the growth continue or will a slowing economy, declining interest rates and reduced federal aid reduce state and local government reserves and investment balances? There has been much speculation to this effect but the big picture, as of June 30, is that the growth trend remained intact.
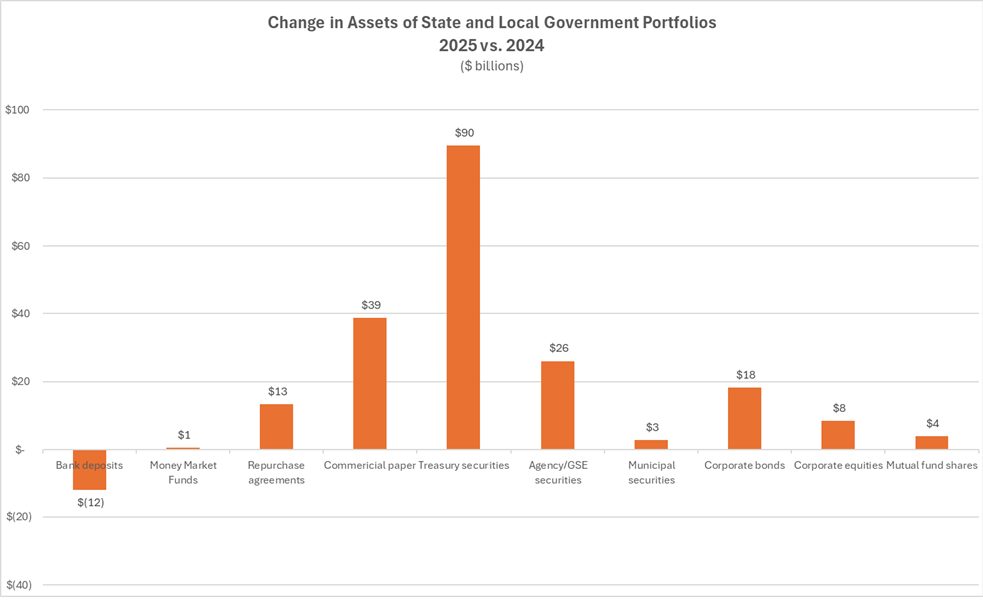
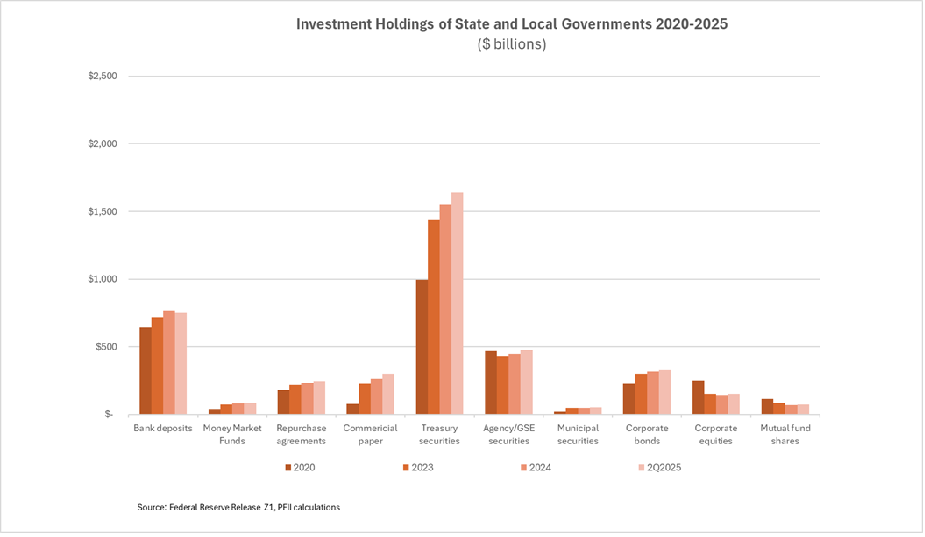
• Investments in Treasuries grew by $90 billion in the quarter, and investments in government sponsored enterprise securities increased $26 billion, continuing a trend that has improved the credit and liquidity profile of portfolios over a multi-year period. At quarter-end government securities were 52% of overall investment holdings. Meanwhile bank deposits declined by $12 billion.
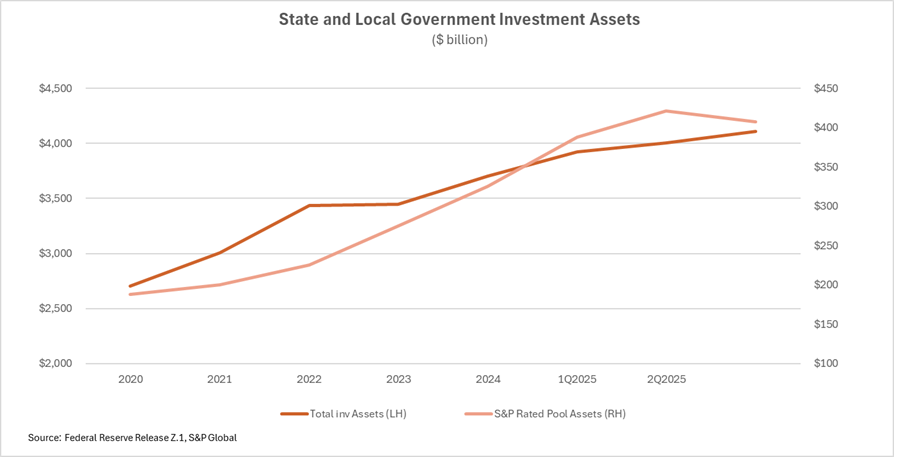
• The Fed report does not distinguish between directly held portfolio securities and those held by local government investment pools, but a separate data series published by S&P Global suggests that the recent growth was in directly held (individual portfolio) investments. S&P reported that total assets of stable value pools that it rates declined by nearly $15 billion in the second quarter compared with a rise of $106 billion in overall public unit investments. This decline came after a period in which LGIP assets grew much more rapidly than those held directly.
The details
Investment assets of state and local governments (excluding pension and other trust funds) were measured at $4.1 trillion in the Federal Reserve’s latest report on Financial Accounts of the United States. This is up from $3.9 trillion as of December 31, 2024, an increase of nearly five percent.
Investment assets have grown by nearly 40% since 2020 (See chart above). The growth has been at an annual rate of about seven percent and has been consistent over the period. Growth of LGIP assets, a component of the Fed’s estimate that is not separately broken out, appears to have been notably strong. Assets of stable value pools rated by S&P more than doubled in size to $407 billion in the 2020-2025 period.
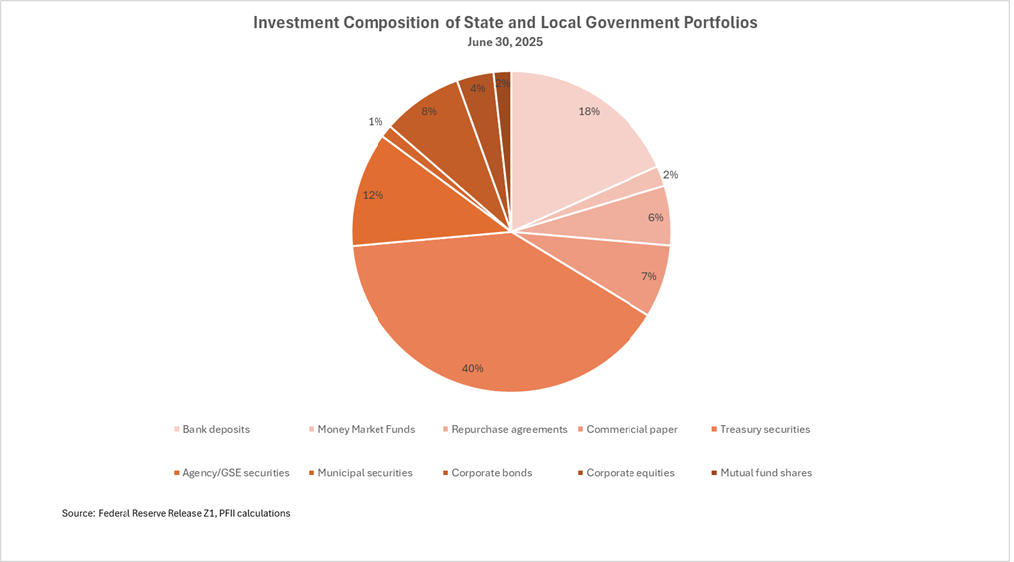
States and localities have consistently increased holdings of government obligations over this multi-year period, and they constituted $1.6 trillion of assets as of June 30. When repurchase agreements are included 58% of assets were in government obligations or investments secured by government obligations.
The trend toward government obligations continued this year as about 61% of assets acquired in 2025 were in these investments.
Since 2020 holdings of Treasuries have grown from 33% of portfolios to 40%. Commercial paper holdings have also increased, but commercial paper is a much smaller component of portfolios. Holdings increased by $225 billion since 2020. They represented about seven percent of aggregate portfolios on June 30.
Bank deposits declined by $12 billion in the first half of 2025. There has also been a continuing shift in the character of deposits as more public unit money goes to support bank services and is held in transaction accounts and cash and less is in deposit/investment accounts.
What’s Fueling Growth?
• Tax revenue grew by 4.5% in the 12 months ending June 30, 2025, and 1.6% in the second quarter, according to a Census Bureau report. Overall, this growth is in line with growth of nominal gross domestic product. Taxes vary by public unit, but in the aggregate property taxes, which account for nearly 40% of revenue grew by only 2.5% while individual income taxes grew by 10.7% and sales taxes by 1.9%.
• Investment income benefited from short-term investment rates greater than five percent for much of the last year. These have declined notably. With the recent Fed cuts to short term rates this source of revenue is likely to decline further in the next year.
• Federal aid accounts for more than one-quarter of combined state and local government revenue and the future is a big unknown.
The Outlook
Uncertainty is top of mind. Macroeconomic factors impact revenue while changes in Federal programs could reduce the flow of aid to states and localities and lead to demands that they fill in for lapses in federal aid. This could well lead states and local governments to tap reserves that are held in investment accounts. The solid growth in these accounts thus far in 2025 is surprising, but it’s far from certain that the trend will continue.


