Uncertainty Ahead: Growth of Public Sector Investment Portfolios Slows, Liquidity Expands

• There are signs that the robust growth in state and local government investment portfolios in recent years is ending even as high interest rates generate strong internal portfolio growth. The recently-released Federal Reserve’s Financial Accounts report showed state and local government assets grew only 0.6% in the quarter ended March 31, 2024 and 4.3% for the 12 months ending March 31, 2024. This is much slower than the growth rate over the last five years when government finances were dominated by the Covid pandemic and response.
• Changes in the financial outlook for the public sector suggest that portfolios may be tapped in coming quarters to meet budget needs. Investment managers may be bolstering liquidity to prepare for this by making greater use of LGIPs that have immediate liquidity. This despite the opportunity to lock in longer-term investments at generation-high yields.
• Public agency investment assets continue to be concentrated in Treasuries, bank deposits and Federal agency securities. This allocation of about 60% of portfolio assets to these investments has been stable for the past several years. Setting aside bank deposits, the securities portion of the portfolios presents minimal credit risk and solid liquidity.
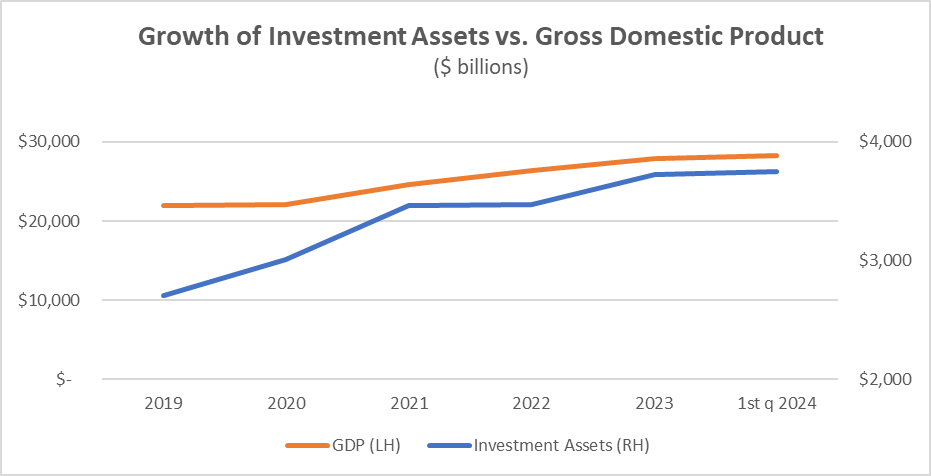
The details. At $3.75 trillion, public sector investment portfolios are a significant factor in the financial markets and an essential element of state and local government finances. Investment balances have grown by nearly 40% over the past five years, from $2.7 trillion in 2019 to $3.75 trillion on March 31. But growth slowed markedly in the past year. When measured more broadly, total financial assets of state and local governments expanded by 3.3% in the 12-month period. This is much lower than the growth of financial assets of households and nonprofits (+9.1%) or nonfinancial businesses (+6.3%). Financial assets include mortgages, trade, and tax receivables.
Comparing the growth in investment assets to the growth in U.S. GDP (the chart at the top of this post) provides an interesting perspective. In 2020 and 2021 state and local government investment portfolios grew at a faster pace than the overall economy as government surpluses expanded.
The Covid-19 pandemic was a notable driver as Federal Covid relief programs swelled state and local government resources. In the past two years, interest earnings also provided a potential source of portfolio growth as short-term rates rose above near-zero levels. In 2022 and 2023 we estimate public funds investment portfolios earned income at roughly four percent per year. This year we estimate the rate will be about five percent and investment portfolios will generate about $175 billion in earnings. If not drawn down, these earnings would provide an internal source of portfolio growth.
Despite the internal growth that high interest rates provide, investment portfolio growth has slowed. It has lagged the GDP growth rate as governments spend Federal Covid aid and budgets go from surplus to deficit positions. This drag on balances is likely to continue as fiscal stimulus wanes and Federal aid spending deadlines approach.
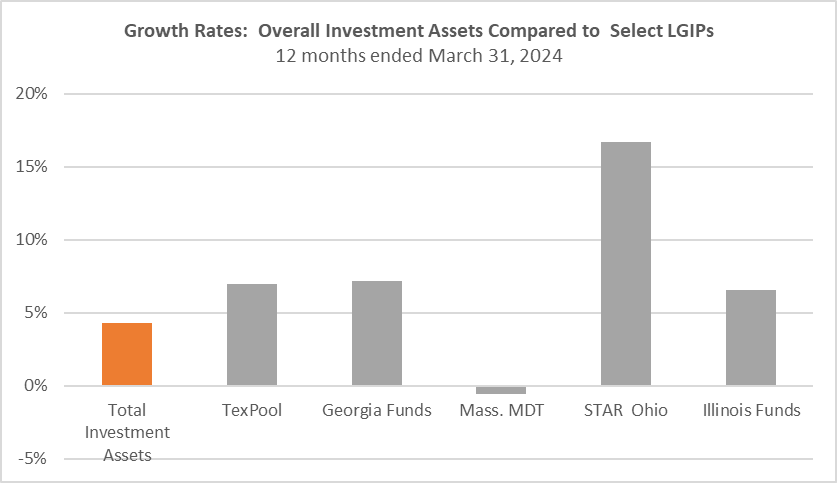
Meanwhile there is evidence that investors have recently increased investments in LGIPs, where the growth rate appears to be much higher than the overall rate of expansion in investment assets. This implies they are foregoing fixed yields for immediate liquidity because LGIP yields will move up—and down—with the overall central bank policy rate.

The Federal Reserve data does not separately identify LGIP investments, but some large state-sponsored LGIPs publish asset data on a regular basis. The accompanying chart shows the asset growth trends for five of them that together represent about $140 billion of LGIP assets. The combined growth rate for the 12-month period was 6.7%, above the 4.3% rate at which overall state and local government investment assets grew.
While the data is not comprehensive, the strong growth rate for LGIPs suggests that they are a growing factor in public funds investments.
Public sector investment portfolio holdings are concentrated in government obligations. Forty-two percent were in Treasuries, 11% in Agencies and six percent in repurchase agreements at the end of the first quarter. Collectively this represents about 60% of assets that present minimal credit risk. Twenty percent were in bank deposits, an allocation that has been stable over the past five years.

Overall portfolio assets grew by $153 billion in the 12-month period. Bank deposits grew by $30 billion (4.2%), and Treasury holdings by $23 billion (1.5%). But asset classes that make up only a minor portion of overall assets expanded rapidly. Corporate equity holdings expanded by $66 billion (25.9%) and mutual fund holdings grew by $19 billion (17.4%). Whether the growth of these minor portion assets represents a trend or is the result of unique circumstances is not clear.
The bottom line. State and local government revenue and spending trends are likely to limit growth of public funds investment portfolios, and may lead to drawdowns in coming months, particularly as Federal aid to state and local governments tapers. Federal grants to state and local government peaked at 5.5%of GDP in 2021. The White House projects they will fall to 3.7% of GDP in 2025, and Republican proposals to cut Federal spending could lead to further reductions. If so, investment portfolios will shrink, durations could shorten, and investment managers could re-position portfolios to support drawdowns to fund government operations.
#
Note on data: This analysis relies on the Federal Reserve’s Z.1 Financial Accounts report. It has significant limitations because of data collection and allocation methods, but as the only effort to account for the financial assets and investment assets of state and local governments on a regular basis it is the best that is.


