
What’s Behind the Decline in Growth of Public Funds Bank Deposits?
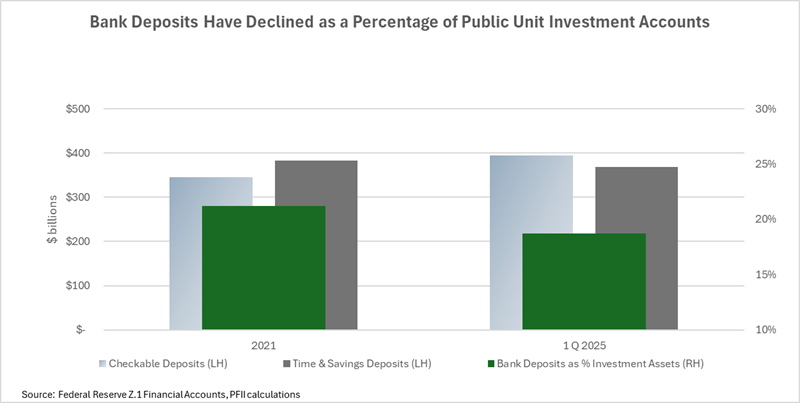
Bank deposits account for about 20% of the investment assets of state and local governments, a share that has declined in the recent years as local government investment pools and direct investment in Treasuries has grown. This concentration understates the importance of banks for smaller governments where deposits are often the only way to make fixed rate investments.
The decline in bank deposits in public unit investment holdings comes as banks move from competing for investment assets to sales of transaction capabilities (and associated sources of bank revenue).
- Deposits have shifted from investment-type accounts to transaction accounts, which have gained share. These accounts expanded by nearly $50 billion while deposit accounts lost about $15 billion in the four-year period. Transaction accounts generally do not pay a market rate of interest though they may offer earning credits.
- The shift in assets comes at a time when short-term interest rates are at generation highs. Banks appear less interested in offering competitive rates for investment as part of the “highest rates” race, focusing instead on expanding their broader financial services offerings that generate fee-based revenue—often paid through compensating deposit balances.
- This trend corresponds with the growth of LGIPs, whose assets now total nearly one in four dollars of public fund investment assets, and money market funds whose assets have ballooned during this period. Where ten years ago the main way banks attracted and retained public fund assets was by competing for investment dollars on a highest rates basis, today their business is more focused on services where the competition is less likely to be the very transparent element of “highest rate offered.” The shift also is notable because technology changes have the potential to reduce the costs of delivering transaction-related services. Yet the growth of balances in these accounts implies that states and local governments are paying more, via higher transaction balances and earnings credit rates, than they were four years ago.
Drill down.
The historic bank business model is changing. Last week we described the change that involves the growing role of the mega banks in the capital markets. Earnings reports from the Global Systemically Important Banks, out this week, reinforce that view. Banks like JP Morgan and Goldman Sachs reported strong earnings for the second quarter of 2025, driven by fixed income trading and investment banking. This is a continuation of the trend in bank business models away from traditional banking that depends on the spread between interest earned on loans and interest paid on deposits. While the G-SIBs have built strong capital markets businesses in a move away from the loan and deposit business, a related transformation is taking place in the broader industry of 4,500 deposit institutions. It involves shifting business from gathering and intermediating deposits to providing fee-based services and offsetting them with the revenue they earn from transaction-based accounts.
The change is reflected in the government banking business of many banks. A decade or two ago government banking was geared toward collateralized investment deposits. Typically a public unit treasurer would bid out deposits to local banks, receiving “best rate” bids and awarding deposits on that basis. In some instances, deposit brokers or fintech firms that aggregated deposits (e.g., CDARS) played as well. The playing field seemed to change as local government investment pools grew in prominence. Banks found themselves competing on rate, even though the fixed rate/no liquidity vs floating rate/daily liquidity characteristics made the rate comparisons much like comparing apples and oranges.
While there has been speculation that bank investment offerings have become less competitive than in the past, until recently there was little quantitative information on which to test this thesis. There has never been a high level of transparency around rates banks offer for collateralized CDs; instead, banks tout it as part of relationship banking (“We’ve got a special rate, just for you.”). Unlike Treasury bills, commercial paper or negotiable CDs, banks did not generally post rates to the public and there was no secondary market trading to track. It was challenging for public agencies to assess the relative value of CDs vs. other investments without going through a bidding process, and even then, there were no generally available rate benchmarks. A municipality might get three bids and identify the highest one with ease, but was the rate a “market rate” when compared with the overall CD marketplace? How did it compare with other money market investments? Was it rich, cheap or of fair value when compared with recent history? These questions were difficult or impossible to assess.
The PFII collateralized CD indices have changed this, making it possible to assess the relative value of collateralized CDs compared with a national rates scale and rates on other money market type investments. The following chart shows some results. In the year since we started collecting this information, we’ve learned a couple of things.
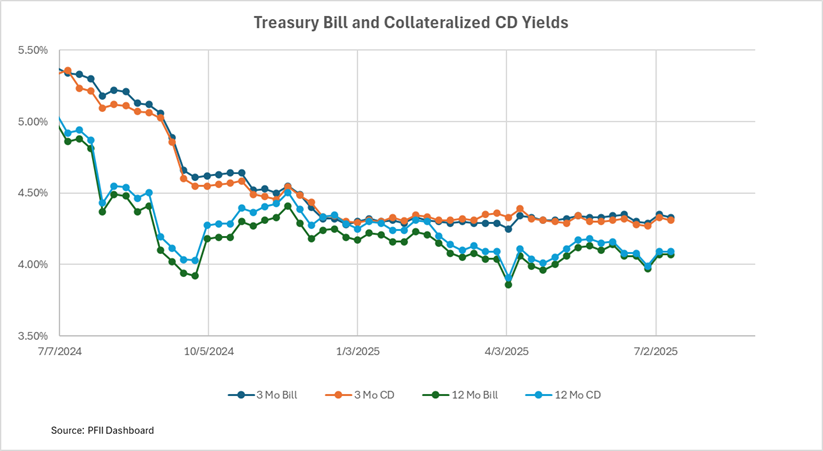
- Collateralized bank CDs on average have not offered a rate advantage compared with rates available on Treasury bills. The accompanying chart and table illustrate this. Over the year the rate for three-month CDs has averaged two basis points lower than the rate on three-month Treasury bills. The rate for 12-month CDs has been seven basis points lower than the rate on one year Treasury bills. Treasury bills are highly liquid and risk-free, and any competing investment would be attractive only at a rate premium.
- Buying Treasury bills may seem to be out of reach for many smaller and midsized local governments, and they may see investing in bank deposits as the only feasible way to obtain a fixed rate. A portfolio manager with national market access is likely not to select a collateralized CD over a Treasury bill when the bill has the same or a higher yield, because buying the bill on an electronic marketplace takes only a minute or two and a half dozen or fewer clicks of the mouse. But in the segment of the market that lacks this capacity a bank may be able to raise a significant amount of public funds deposits at a rate that is below the rate available on the Treasury bill. (There are some recent fintech innovations that could change this dynamic, but they are not widely known or used in the public funds space. We’ll be working on some educational materials in the coming months to introduce these tools widely to government investors.)
The growth of LGIPs has altered the competitive landscape for banks. One way of thinking about LGIPs is that they provide access to the wholesale rates available in the national money markets less a fee of 10-20 basis points (the LGIP’s expense ratio). This may not be an entirely fair comparison—LGIPs and deposits have different liquidity characteristics and the rate on one is variable while on the other it is fixed. But the reality may well be that banks find themselves competing on this basis. It is no wonder that bankers’ groups in a number of states have advocated recently for legislation that would limit the activities of LGIPs.
Banks have also been successful in shifting their business offerings toward banking services that are paid for with fees and transaction balances. Payment services, payment services with fraud protection, deposit processing, money movement, custody services, custody plus investment accounting, are now a significant—and sometimes the prime—offering of government bankers. These meet the evolving needs of public agencies, but we should note three other attributes:
The services are sticky. It’s not easy to change the service provider, as compared with the ease of moving money from one CD to another.
Calculating and comparing true costs is challenging. While banks may charge on a per unit basis the actual cost depends on transaction volumes, price tiering and other elements. In a word it’s complicated.
Transaction account balances provide a way to pay that meets budget objectives but also are opaque. Consider how straightforward it is to compare rates for collateralized CDs over time with rates on other money market investments, then consider how to do something similar for transaction accounts.
The Big Picture.
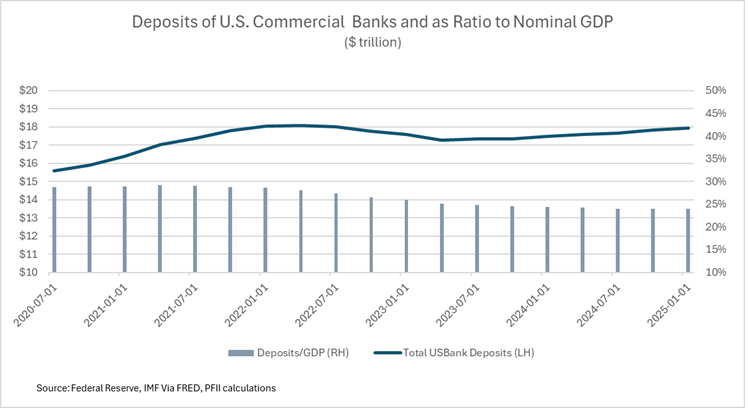 Bank deposit growth has been flat over the past four years after zooming higher during the pandemic. Deposits represented 75% of GDP at the beginning of 2022 but only represent 56% today. This is a significant shift that evidences the changing role of banks in the nation’s economy. Not that the banking business has stagnated; it’s just that it has changed in this period. The G-SIBs have built formidable capital market businesses while the industry has shifted its business away from the traditional deposit/loan management efforts even as the landscape of public funds investment has changed. Cause and effect or cause and cause? Time will tell.


