
Where Next? A Review of Recent Investment Performance
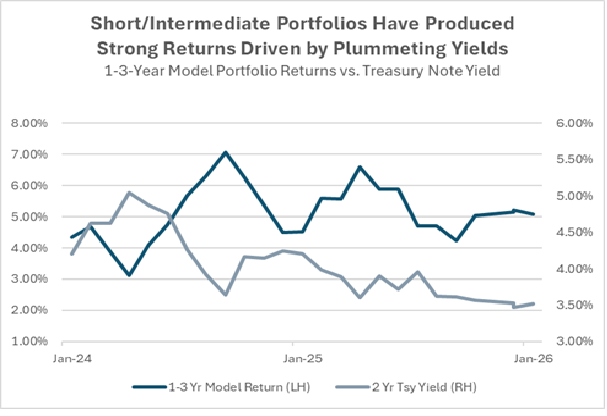 Short/intermediate term fixed income portfolios have had strong returns recently. For the past 18 months or so as the Federal Reserve eased monetary conditions and interest rates fell they out-performed local government investment pools and other cash investments by a healthy margin.
- In the 12 months ending January 2026 our 1-3-year model portfolio returned 5.08%. That compares with a return of 4.38% for the PFII Prime LGIP index. Longer-duration portfolios did even better. (Model portfolio returns and statistics are reported on the Investment Dashboard and updated monthly.)
- The lead by short/intermediate fixed income investments is a change from the period 2022-2024 and the longer 10-year period when LGIP and cash investments outperformed.
The superior results from fixed income portfolios in the most recent 12-month period are due to two factors:
- Interest rates declined, with the yield on the two-year Treasury note dropping more than 60 basis points in the last year.
- Spreads between corporate bonds and Treasuries tightened, with an index of spreads on 1-3-year bonds shrinking by seven basis points.
The Details
Over the past 12 months the Treasury holdings in our 1–3-year portfolio returned 4.89% and the corporate holdings returned 5.65%. With 60% invested in Treasuries, 30% in credit and 10% in a liquid cash investment the overall result was 5.08%. Our longer maturity portfolio, which is invested out to five years, returned 5.68% because the interest rate decline and spread compression had a greater impact on securities with longer maturities. The return over this period for 1–5-year investment grade corporate bonds was 6.38%.
Longer is not always better. Measured over a longer investment horizon, the return of short/intermediate term portfolios compared with LGIPs/cash does not favor longer-maturities. For example, over a ten-year period a money market fund proxy for the PFII Prime LGIP index returned 2.31%, while benchmark indices representing a 1–5-year portfolio with 30% invested in corporate bonds returned 2.10%.
Of course there are periods where longer-duration portfolios outperform an LGIP but to take advantage of this one would have to be able to time the markets successfully, shifting into cash or an LGIP just before rates rise and shifting back to a longer-duration portfolio just before they fell. Without dismissing the skills of public funds portfolio managers, that ability mints billionaire hedge fund managers; it’s not shared by the rest of us.
Fixed Maturity Investments Have a Place
With that perspective, the best way to rationalize buying longer-duration securities is to fund a known liability or provide stability to income that is expected from an investment portfolio.
Funding a construction program with a known draw schedule is a good example of the former. If you borrow $25 million to build a school, you want the proceeds of the borrowing to be sufficient to pay for the project. The way to do this is to invest a significant portion of the borrowing in fixed maturity fixed rate securities. (You might also consider a fixed rate deposit or investment agreement that permits draws to pay project costs. That involves a financial institution taking the market risk in return for a fee,)
Buying longer-maturity fixed rate investments is also a way to level interest income over one, or several, budget cycles. Consider the choice to invest in a 2-year Treasury note today, meanwhile passing up the opportunity to invest in an LGIP. The yield on the Treasury note is about 25 basis points lower than the yield on the LGIP. But the Treasury note provides a fixed source of income (3.55% at this writinng) for two years. With the LGIP the income stream is uncertain. It could exceed the Treasury-based income over this period or under-perform. Where certainty is valuable it may be worth giving up yield to achieve it.
Looking Forward
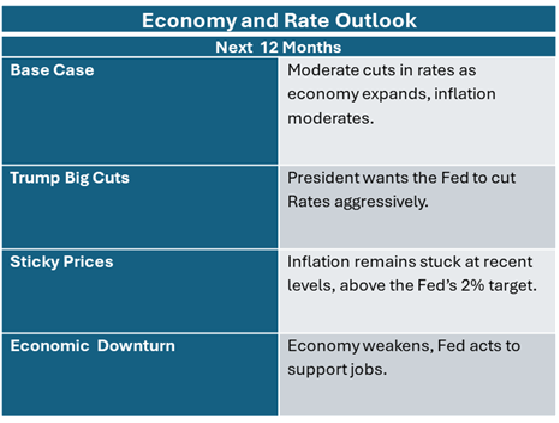
Let’s start with the outlook for LGIP results over the next year. To estimate how much future income is at risk by investing in an LGIP we constructed four scenarios, meant to capture the variety of future paths for rates that seem plausible. The scenarios, in summary, are as follows:
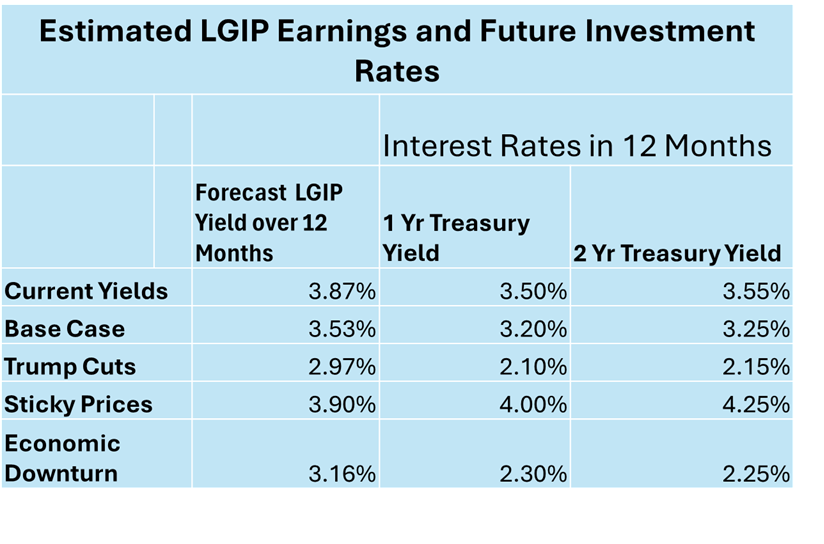
Next, we constructed a yield curve for each scenario and used it to estimate the yield on a prime LGIP over 12 months if interest rates follow a specified path from the current levels to the terminal (12 month) levels. We also incorporated the timing and lags in LGIP rates because they do not instantaneously respond to changes in cash market yields. And we specified rates on 12-month and 2-year Treasuries a year from now. The results of the analysis are as follows:
I don’t know if any of the scenarios will materialize, nor could I say that the forecast results will be achieved. But I have confidence in several important conclusions from this analysis.
First, there is not a lot of upside in current LGIP rates. LGIP yields are likely to be notably lower than the 4.38% yield that the PFII Prime LGIP index produced in the past 12 months. They could be lower by more than one percent, or just marginally lower. If I were considering investing solely in an LGIP I’d want to run something like this range of income results up the flagpole, so to speak, to see whether it was acceptable to budget/management folks. And in doing so I’d consider the value of liquidity for unforeseen circumstances.
Second, the outlook for rates in 12 months presents a systematic view of the effects of a variety of economic forecasts on interest rates. It is based on a forecast yield curve that is associated with each. (If you use this approach, you can create your own set of assumptions.) It also suggests the range of investment rates that might be available a year from now. To re-state a point made earlier, if I put a high probability on scenarios that would lead to rates sharply lower than current ones AND I want to assure income over two years at about 3.50% I could invest in a two-year Treasury note. If rates turned higher (the Sticky Prices scenario) I would have given up about 40 basis points in the first year, and likely more than this in year 2. And I would have an unrealized loss at the end of the first year of roughly .45% (the difference between the 4.00% yield on a one year investment a year from now assumed in that scenario and 3.55%). But I would have assured income over two years of 3.55%.
If I were confident that rates would not decline a lot from here and had a preference for liquidity, I could limit my investments to an LGIP (and similar cash investments). I could estimate the range of costs (foregone earnings) from this analysis. I’d have quantified the risks and potential rewards from my strategy.


