
The Upcoming FOMC Meeting: Lower Rates Likely
The October meeting of the Federal Open Market Committee is likely to produce two results that will lower rates for public funds investors.
• The Fed seems set to lower its main policy rate by 25 basis points. Rates for short-term investments like Treasury bills, commercial paper and collateralized certificates of deposit have already dropped to reflect this. Local government investment pool rates, which lag the market, will catch up over the following 30-60 days.
• The central bank is likely to end its quantitative tightening program. Tightening reverses a temporary quantitative easing effort that the Fed has employed only a few times in recent years to impact longer tenor rates. The easing program has been scaled down considerably from its peak in June 2022. The main impact of ending tightening will be on bank reserves and the repurchase agreement market, where failure to stop shrinking the Fed’s balance sheet could push repurchase agreement rates above the federal funds level and create volatility and liquidity in the short term markets.
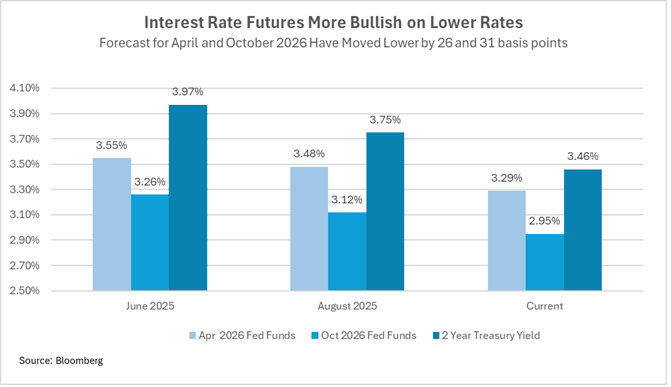
The market currently reflects this outlook. Investors are more bullish on lower rates than they were over the summer. As the above chart documents, two-year Treasury yields have declined by about 51 basis points since summer, while the level of federal funds expected for April 2026 dropped by 26 basis points and the level for next October dropped by 31 basis points. One way to interpret this is that the two-year Treasury yield represents greater certainty as to the level of rates in coming months rather than an increased bet that rates will be even lower than forecast during the summer.
All of this will occur even as the Fed and the markets are somewhat in the dark when it comes to the two factors that normally drive monetary policy: jobs and inflation. A market that has been built around data transparency and can react quickly, and sometime violently, to data on labor market health and inflation is suddenly without much of this information because of the government shutdown. Never mind if accustomed waypoints are not visible: Just put it on auto and proceed.
The details
The current federal funds rate, set by the Fed at its September 17 meeting, is 4.00-4.25%. This is down from a peak of 5.25-5.50% prior to September 2024. The peak rate was achieved as inflation surged in 2022-23. The decline in inflation since then led the Fed to reduce its benchmark rate. Where is inflation now? Significantly lower than the 8% plus rate we experienced in the summer of 2022 but, at “around” 3%, still above the long-standing Fed target of 2%.
We say “around” 3% because some of the key data that normally informs markets is not being published while the government is shut down. Earlier today the Bureau of Labor Statistics published its estimate of consumer prices for September after a shut-down-related delay but also announced that there may not be an inflation report next month if the shutdown continues. Other inflation data, important to gaining comprehensive perspective on price movements, is similarly delayed.
Current information on the second main factor in Fed monetary policy, the condition of the labor market, is similarly somewhat obscure. It seems certain that the pace of job creation has slowed from the level of 168,000 per month in 2024. For the last three months reported (June-August) new nonfarm jobs averaged 29,000 per month. There is no official data for September or October, but private estimates/guesses suggest the trend has continued.
Ordinarily inflation above the Fed’s target and a slow, but still positive trend in the labor force might lead the central bank to hesitate, but it’s clear that both political and market forces (note the stock market) are demanding cuts NOW. The central bank may be independent, but it is not immune to political and market influences, and at this point they argue for/demand cuts.
While the talking heads will focus their reporting on the federal funds rate, insiders will be more concerned about the Fed’s quantitative tightening program. Since the Great Recession, the central bank has had an elevated presence in the Treasury market as by far its largest buyer.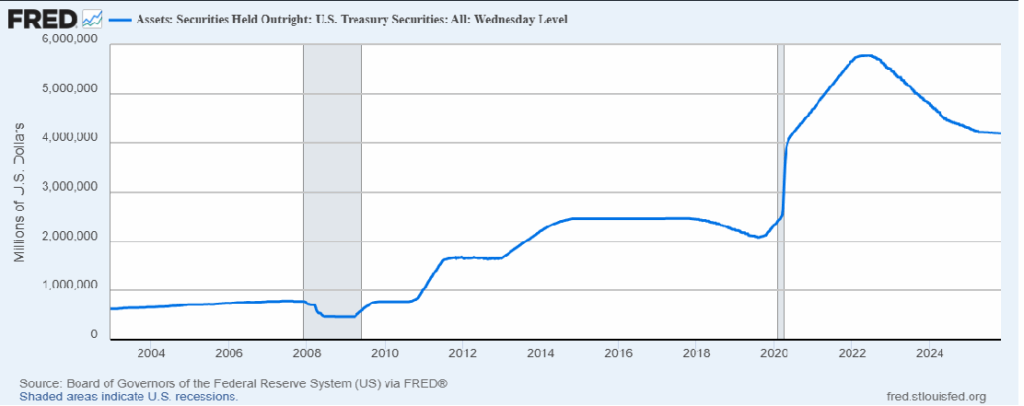
For history it seems quaint that the Fed’s Treasury holdings were less than $700 billion in 2007. As the above chart documents, the Fed expanded its holdings to $2.5 trillion in 2014 to force long term rates lower. It expanded its holdings again, during the pandemic, to a peak of $5.8 trillion to boost the economy. (Holdings of mortgage-backed securities added another $2.7 billion to the Fed’s balance sheet at its peak.) Since then, it has reversed course, allowing most of its maturing securities to roll off without reinvesting. As its holdings declined it has slowed the pace of runoff.
The boost in Fed holdings came at a time when the Treasury ramped up its issuance to fund the ongoing budget deficit so the Fed, in a sense, helped to fund the deficit.
Since April, the Fed has been buying about $5 billion a month, so ending this is not likely to have a big impact on the Treasury market, where the outstanding debt has eclipsed $38 trillion and volumes are around $1 trillion(!) a day.
But the move, or lack of move, will affect the funding markets and bank liquidity. This is all a bit wonky, but important. Without getting into (important) details about bank reserves and lending capacity and introducing a bunch of new acronyms (IOER, swap levels) the impact on public funds investors will largely be experienced through the rate on repurchase agreements, which make up 10% to as high as 40% of the holdings of LGIPs and money funds.
Normally the repurchase agreement rate tracks the federal funds rate closely. In the last five years the two have average within two basis points of one another. But from time to time, they part ways.
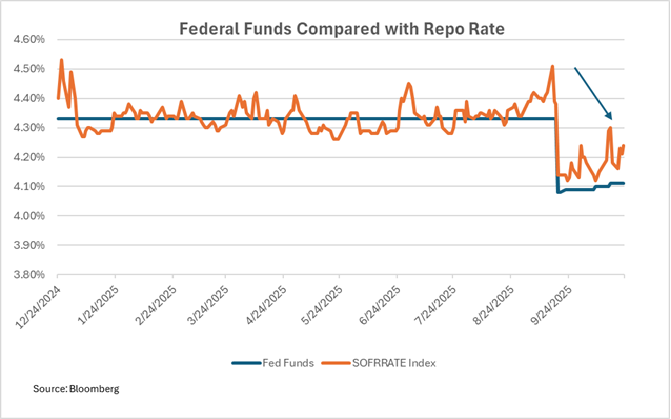
This is one of those times. In the past two weeks the rate on repo, as measured by the Fed, exceeded the federal funds rate by 12 basis points. This is good for LGIPs, and their investors, but not so good for banks or central bank monetary policy, so the Fed is likely to take steps, by ending its quantitative tightening, to push the repo rate back down to a level that is closely aligned with the federal funds rate.
Bottom Line
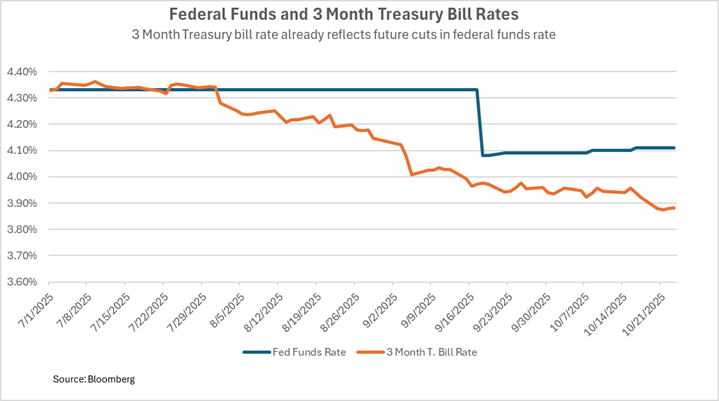
Look for LGIP rates to trend lower by 20-25 basis points over the next 30-60 days if the Fed cuts. Rates on other short-term investments like bank CDs and commercial paper already reflect a lower policy rate—see the below chart—but if investors believe the Fed will continue its path of lowering rates at upcoming meetings they too will trend lower. If the current market expectation for federal funds of 3.25% next April is achieved, three-month Treasury yields could decline in coming weeks by 50 basis points, with other investments tracking along.
One year and two year investments could settle at a level of 3.00%-3.25% to adjust to a federal funds rate of around 3%, This is consistent with the current expectation of futures markets, but more importantly it is consistent with an outlook for a slow economy (but one that avoids recession), inflation that is above the Fed’s desired target but not rocketing out of control, and a political force that continues to demand lower rates.
For public funds investors the choice of whether to maintain funds in an LGIP or invest for a term of one or two years is better evaluated by viewing the timing of investment income receipt and importance of liquidity than by seeking to call the markets.
To illustrate, using very crude arithmetic an investment today in a two-year Treasury is certain to produce about 3.50% of income each year for a total of 7% over two years. An investment in an LGIP could produce 4% in the next 12 months and 3% the following year. Maybe the income on the second option is a bit less certain and it could be a bit lower if the Fed eases more aggressively, but if liquidity is important this “cost” of liquidity, if any, might be preferred.
________
This post has been updated to clarify the operation of the Federal Reserve’s quantitative easing program.


