
Bank CDs: Available for Investment, But is There Value?
 States and localities have long invested in bank certificates of deposit because they are familiar, easy to acquire and may be viewed as serving the community. In most cases the issuing bank must collateralize the deposit, so CDs are viewed as having low risk. But changes in the bank business model may have made this investment less attractive for many public funds investors.
This shows in the PFII CD indices that have tracked rates on collateralized CDs for more than a year, bringing transparency to what was an opaque market.
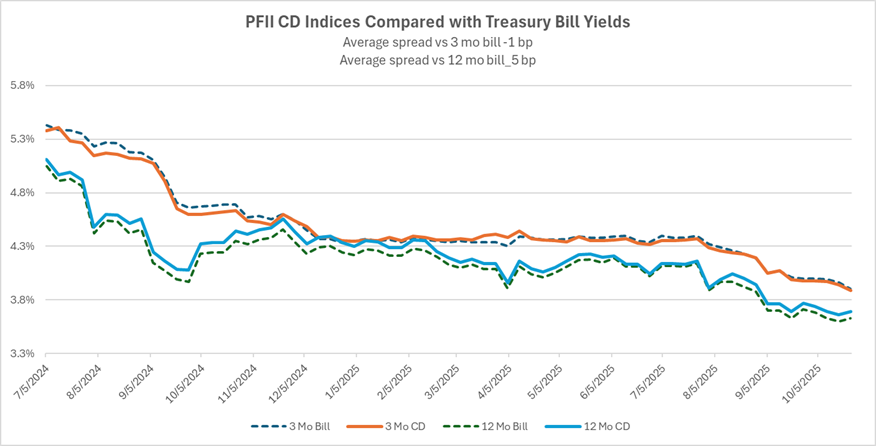
The PFII CD indices show collateralized CDs offer little if any rate advantage over investing in Treasury bills. Since we began compiling the indices in July 2024 the three-month CD index has averaged two basis points less than the rate on three-month Treasury bills. For 12-month maturities the CD index averaged six basis points more than that of comparable-maturity bills.
Why do public units continue to invest in collateralized CDs despite little if any rate advantage over Treasuries? In a few words, they are familiar and easy to buy, and, in some cases, they address a desire to “keep the money local” though whether the money stays local once invested is open for debate.
Intuition might suggest that bank CD rates should be higher than those on Treasury bills because CDs have (somewhat) more risk and lack the liquidity of bills. But other factors apply:
- Banks appear more interested in selling transaction services with their related deposit accounts than issuing CDs to raise deposits. Public unit bank deposits related to transaction accounts (checking, payments, custody) have grown in the past five years while investment type deposits have declined.
- Large banks have access to the wholesale funding markets by issuing commercial paper, bonds, and negotiable CDs. They have accessed funding that is relatively cheap, benefiting from the positive market for corporate issuance in recent years. Their market share of the public funds market nationally is not easily known but in several states that publish statistics they dominate.
- The evolution of the FHL Banks from an agency highly focused on supporting housing to a vehicle that provides funding for banks offers banks a way to fund themselves at a rate that is nearly as low as the rate at which the Treasury borrows.
- The growth of local government investment pools has presented banks with a more complex competitive landscape. The vast majority of bank deposit programs offer fixed rates while rates on the majority of LGIPs vary with moves in the short-term fixed income markets. Rather than compete in an apples vs oranges comparison banks have focused on selling services with an offer of a deposit account earning at below market interest rate to offset costs. From the bank’s view this takes them out of the highly commoditized “the highest rate wins, no matter what” and into selling the services-for-cost. It may not be incidental that the value of earnings credits is difficult to quantify and compare and benchmarking is challenging.
The Details
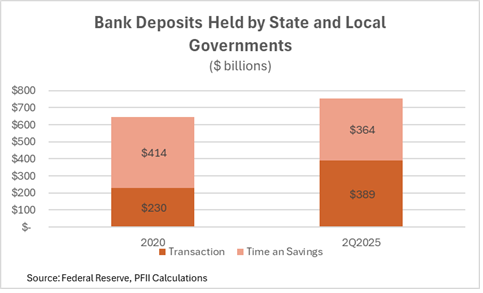
Recent data compiled by the Federal Reserve show that bank deposits totaled about $750 billion of public unit investment holdings as of June 30, 2025. Bank deposits have not kept up with the overall growth in public funds investment in recent years. Five years ago they made up 21% of investment holdings. At the end of June they were 18%.
More significantly, though, the mix of bank deposits has changed Transaction account balances gained $159 billion while investment-type accounts (savings and time deposit CDs) lost $50 billion. That represents a noted shift: banks now market services and earnings credits when in the past they were more focused on rate-based deposit gathering.
From the perspective of the bank, it is likely that selling transaction services is preferred. In a few words, with this shift bank offerings are less commoditized, but the cost is also less transparent. This puts bank customers—states and local governments—at somewhat of a disadvantage in evaluating bank products. Where CD rates are easily compared and the price (rate) is somewhat transparent, earnings credit rate-based accounts are less so. The true cost relates not just to the headline rate but also to such things as minimum balance requirements, investible funds rules, etc. and also relates to the cost of the transaction services.
National statistics of the volume of collateralized deposits held by large vs. small banks are not available but there is some insight in the statistics published by several states that maintain records of state-administered collateralization programs. In New Jersey, based on recent filings with the banking department, the largest global banks accounted for 25% of collateralized deposits and large regional banks, another 33%. In Florida global banks accounted for 34% and regional banks accounted for 43% of collateralized deposits.
These global and regional banks have access to the wholesale funding markets—the largest issue commercial paper and negotiable CDs—so their pricing of collateralized deposits will reflect this. If a large bank can fund itself with commercial paper at a cost of 15 or 20 basis points over Treasuries, and without pledging collateral, this offers a kind of upper limit on the rate the bank will offer for public funds CDs.
All banks also have access to the FHL Banks funding programs. In the wake of the 2023 failure of Silicon Valley Bank the industry upped the use of FHL Banks funding, and it now totals about $1.2 trillion, up from $652 billion two years ago. Banks borrow from the FHL Banks at a rate that is only slightly higher than the rate that FHL Banks—which are federal agencies—pay to borrow in the public markets. This rate is not more than a few (5-10) basis points over Treasury rates.
Price and Rate Transparency
Shopping for the best rate is an issue for states and localities. Several states run periodic bid programs on a regular basis, but for smaller entities the protocol seems to be to call or email selected financial institutions for rates when they have money to invest.
If you want to buy a Treasury bill you can compare the price/yield offered by a broker with the prices reported by the Federal Reserve on a daily basis to see whether you receive a fair deal (or if you are a large entity you can buy on a competitive electronic marketplace with as few clicks of a mouse). But no such transparency had existed in the collateralized CD market. The PFII CD indices seek to address this. They seek to capture rates in a standardized manner. But they are not without (recognized) limitations, particularly around the matter of differing state-specific collateralization requirements that cost banks differently and thus influence the rate they offer for deposits.
Price and rate transparency is also an issue for products like CDARS that offer to distribute deposits to multiple banks to obtain full Federal Deposit Insurance Corporation insurance coverage. These too lack uniform price (rate) transparency. The aggregators have this information, but they hold it closely.
Bottom Line
With collateralized CDs offering rates that are close to those of Treasury bills, why not select bills? Greater knowledge of price and rate transparency may lead to this, but the appeal of a CD is familiarity, particularly to part-time investors.
A sophisticated investor who is in the market every day and has access to electronic markets can easily buy Treasuries. For the rest, the process may be off putting. Until technology puts this capability in the hands of a wide group of public funds investors, CDs remain one of the few practical means of locking in fixed rates.
____________________________
A note on the CD indices:
Rates for collateralized deposits are available on the Dashboard page of the website and can be downloaded from there. The rates are compiled from bids received by state treasurers for non-negotiable CDs and/or time deposits. The rates are on a 365-day basis. Seven states currently are part of the survey. The total of outstanding time deposits in the survey is approximately $3 billion.
For further information see the Dashboard Sources page on the website.


