Annual Survey of Local Government Investment Pools: Modest Growth in Pool Assets, New Entrants Expand the Market
 Local government investment pools grew modestly in 2025 with a number of new pools and assets increasing to $967 billion. The asset growth rate of 4% was less than the reported increase in state and local government investment assets, as states and municipalities also grew their separately managed investment portfolios.
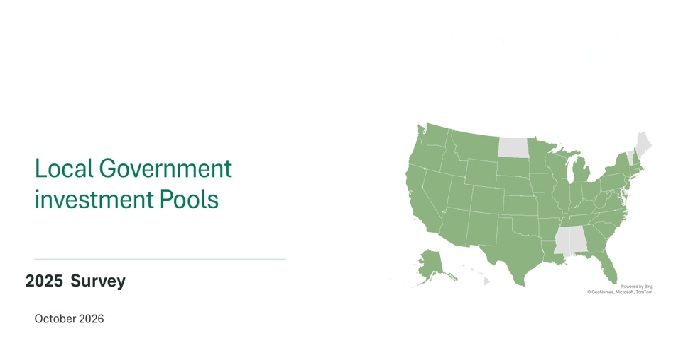
Our annual survey of local government investment pools identified 180 portfolios operated by 57 pools in 43 states. It is the only comprehensive look at the LGIP industry which invests assets for thousands of public units across the country.
Here are highlights:
- LGIPs held $967 billion in state and local government assets at the end of last year. The total was $34 billion higher than in 2024. This was about one quarter of overall public funds investment assets.
- State sponsored programs dominate the LGIP industry with assets totaling $703 billion in 32 states. Average portfolio size was $14.9 billion in 47 portfolios.
- Local sponsored LGIPs are smaller, with average size of $2.0 billion, but there are many more of them, 133 portfolios in our survey.
- Industry growth was fueled by local money. Local-sponsored LGIP assets were $264 billion, up $21 billion over 2024 and local government money in state-sponsored pools also grew by $21 billion. Locality assets represent more than 2/3 of overall LGIP assets.
- Most state-sponsored portfolio assets are managed internally, but outside managers are responsible for nearly 30% of assets. All local sponsored LGIPs have external managers.
- Stable value portfolios constituted more than 99% of LGIP assets. These seek to provide a constant net asset value just as money market mutual funds do. Some LGIPs also offer longer duration investment portfolios. While there were 31 of these offered, their assets totaled barely $20 billion.
- LGIPs compete with money market funds whose assets totaled more than $8 trillion at the end of last year. LGIPs are not subject to most Securities and Exchange Commission rules, and they operate with greater flexibility than registered funds.
- Local-sponsored pools put a new emphasis on fixed rate fixed term portfolios, offering stable value at scheduled maturity. They represent only a small amount of overall assets.
- Expense ratio for LGIPs were higher in 2025 than in 2024, averaging 12.9 basis points, compared to 12.2 basis points in 2024. State-sponsored pools had much lower expense ratios, averaging 6.1 basis points, up from 5.8 basis points in 2024.
- Local sponsored LGIP expense ratios were appreciably higher, averaging 19.8 basis points.
- Disclosure and transparency by LGIPs improved from 2024 with several now matching the disclosure/transparency required of money market mutual funds but a majority did not offer contemporary information on liquidity, portfolio risk, or asset flows.
The survey results provide state treasurers and trustees of LGIPs with details on how programs operate across the nation. They also provide investors with key information to help them evaluate and monitor LGIPs that they invest in. For details download the full report here.