
State and Local Government Investment Assets Continue to Grow Despite Economic and Fiscal Uncertainty
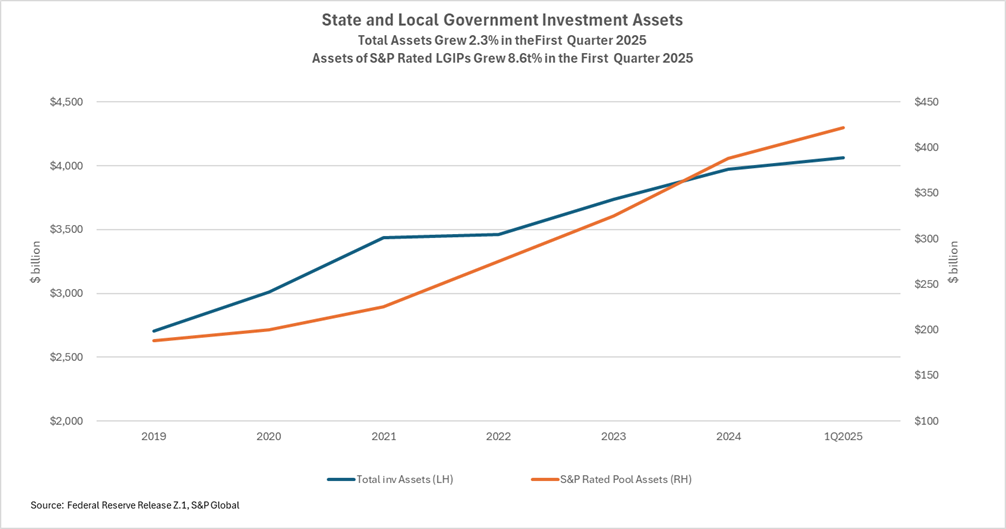
State and local government investment assets continued to expand in recent months, surpassing $4 trillion at the end of March, according to the Federal Reserve’s new quarterly report on the Financial Accounts of the United States. This was despite a rise in economic uncertainty and evidence of a fall-off in state and local government revenue growth.
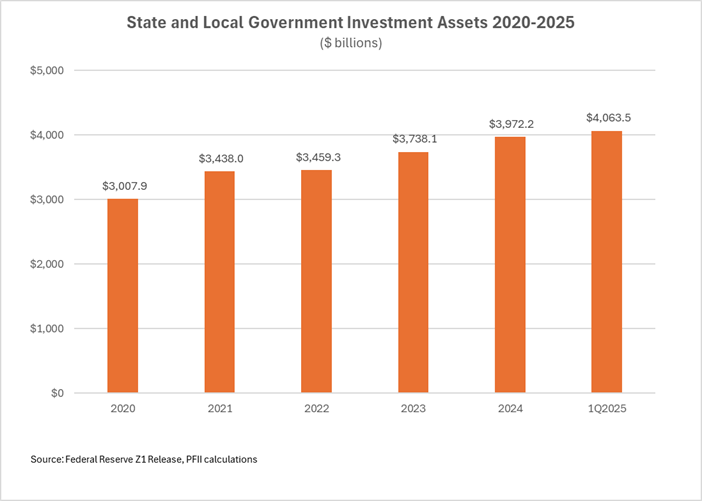
• The Federal Reserve’s just-released report shows assets grew to $4.064 trillion in the quarter ended March 31. This is up 2.5% over the year-end figure and 7.5% over the level in March 2024.
• A more limited measure of assets compiled by S&P Global, which tracks assets of local government investment pools it rates, grew 9% in the quarter to $422 billion. This is up by 12% over the prior 12 months.
• The growth in investment assets comes at a time when many state and local government officials are concerned about budget pressure from reduced Federal grants, slowing economic growth and the possibility of rising inflation.
• High short-term interest rates that boosted portfolio earnings and a surge in bond issuance contributed to growth of investment account balances. These supplemented tax revenue growth which has been in the 2-2.5% range, according to analysts.
• While individual public unit conditions vary, there is evidence that municipalities experienced stronger growth than states. This may be because a number of states enacted tax cuts in the past two years while municipalities, reliant on the steady flow of property taxes, were less likely to adjust tax rates.
The Details.
Investment assets of state and local governments have grown by more than $1 trillion since 2020. Assets expanded by $91 billion in the first quarter, double the pace in the comparable quarter last year. The growth drivers are not clear from the Fed report, but as a general matter government revenues have three recurring sources: taxes, other charges and grants/transfer payments. The first two generally track the pace of overall economic growth. Nominal gross domestic product expanded by 4.7% in 2024 and 0.8% in the first quarter of this year. Growth in the next 12 months is widely forecast to be lower than this pace.
Two sources likely boosted investment balances. Investment earnings have been strong. Assets earned at a level of around 5% last year and around 4.50% in the first quarter of 2025, far higher than the rate in the years before and during the Covid pandemic. And states and local governments issued $513 billion of bonds in 2024, a record that was 33% over 2024 levels. The proceeds of these bonds are invested in state and municipality accounts pending their use to pay project costs.
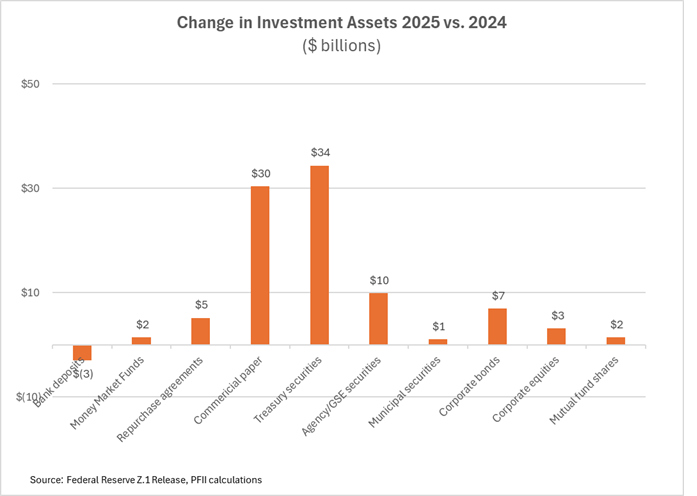
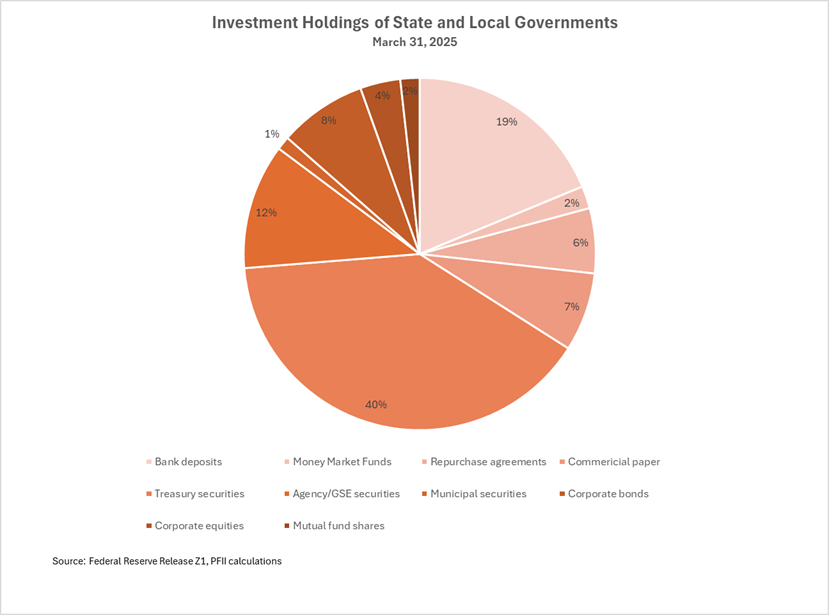
The increase in investment assets in the first quarter was invested largely in government obligations (Treasury and Federal agency securities) and commercial paper. The allocation to Treasuries is consistent with the trend over the last five years, which has seen Treasury holdings grow by $617 billion to $1.6 trillion. (See chart below.) Holdings of Federal agency obligations, once a mainstay of public unit portfolios, increased modestly over the quarter and over the five-year period, likely because their supply has been constrained and they have offered little if any yield pick-up compared with Treasuries.
Commercial paper holdings have grown by nearly 400% in the five-year period from $77 billion in 2020 to $294 billion at March 31, 2025. Total commercial paper outstanding has grown by $370 billion in this period, so state and local government investors have absorbed most of this increase. Corporate bond holdings also rose, but corporate bond holdings represent a somewhat smaller allocation than they did five years ago.
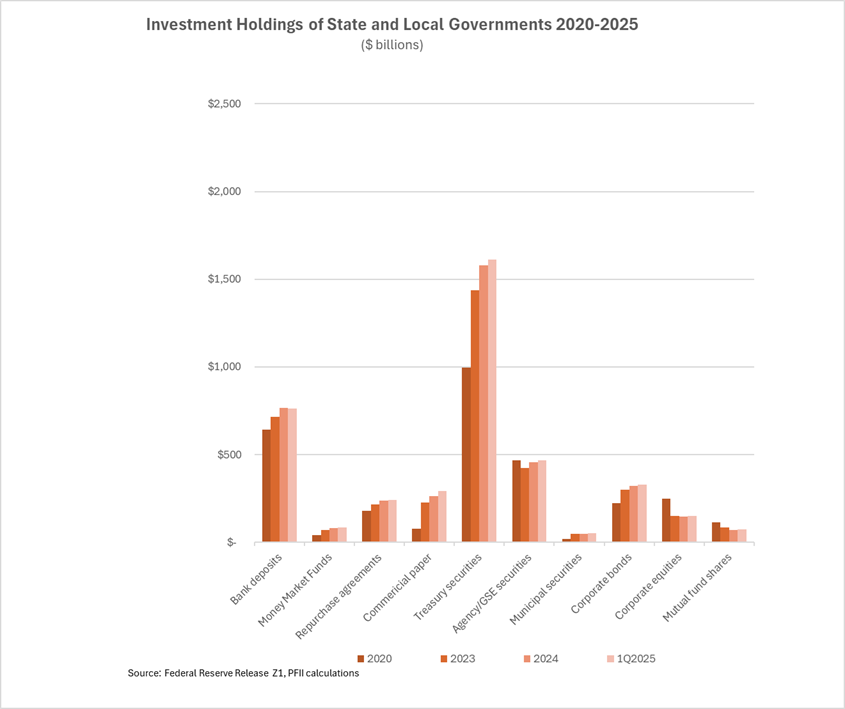
Bank deposits totaled $762 billion at the end of March, a decline of $3 billion in the quarter and were 19% of holdings. Bank deposits are nearly equally divided between time deposits and certificates of deposit that are utilized for investment purposes and transaction-related accounts.
Bank deposits have grown by 18% since the beginning of 2020, and they accounted for 19% of public unit assets at the end of March, down from 21%, in 2020. The decline in investment-related accounts has been pronounced. They lost about $45 billion in the five-year period. The PFII Index of Bank CD rates, which we’ve tracked for about the last year, indicates that bank CD rates have not been particularly attractive when compared to rates on other money market investments.
Bank transaction accounts, which support banking activities, grew by $165 billion in the five year period and $3.4 billion in the quarter. It is likely that this growth relates to the increased cost of banking services and preference of many public agencies to pay for these services by leaving balances on deposit.
The Fed data reported that money market mutual funds are a small part of the overall holdings of states and municipalities, totaling $83 billion at the end of the quarter. This is a small fraction of overall money market fund assets which totaled $7.4 trillion at the end of March. Holdings by states and municipalities were up $2 billion in the quarter and grew by $10 billion in the 2023-2024 period. LGIPs are a strong alternative to money market funds. Our annual survey of LGIPs, due for release next month, will show total assets of nearly $1 trillion at the end of 2024.
The estimate for public unit assets in money market funds may be under-reported because some proceeds of municipal bonds are held in bank trust accounts that may not be tallied as public unit investments, but even with this caveat it is clear that money market funds do not have a major place in public unit investment portfolios; the specialized local government pools, are strongly preferred.
Bottom line.
The financial capacity of state and local governments improved in the quarter, a trend that has been ongoing for several years. Overall measures suggest that the investment assets are highly liquid, with nearly 70% in government obligations, transaction-related bank deposits, repurchase agreements and money market funds. LGIP assets are not broken out separately in the report but the strong growth in assets of rated LGIPs is another measure of overall liquidity.
With heightened uncertainty around the pace of economic growth and the level of Federal spending that will be budgeted for the next fiscal year, state and local governments may have to consider increasing their spending for social safety net programs and to make up for reduced money from Washington. Those that have healthy and liquid investment accounts will be better able to manage these priorities.


