Transparency: The Fed’s Mandate

Federal Reserve Chair Kevin Warsh’s post Federal Open Committee meeting news conference got me thinking about how much information transparency has shaped the financial markets since I entered the business nearly 50 years ago, and the implications if the Fed moves to reduce transparency and access to information by ordinary investors, including those who manage public funds.
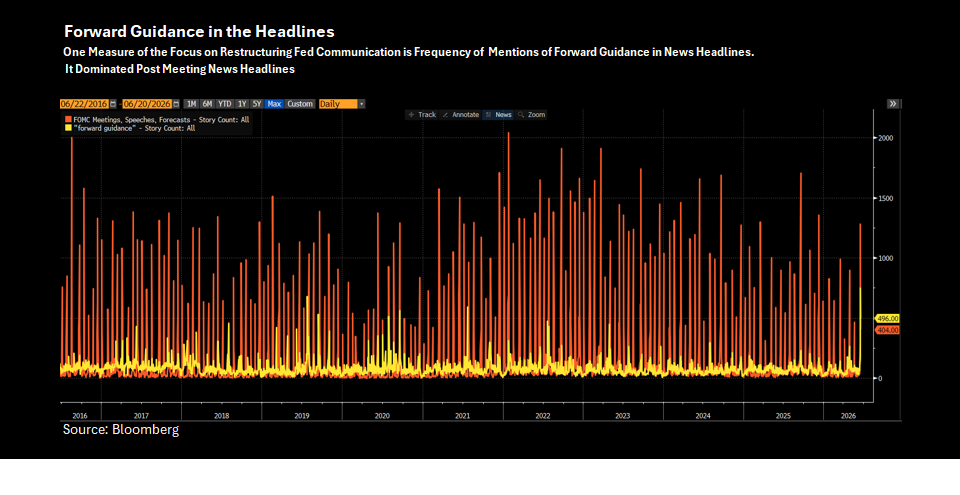
Warsh opened the door to changing how the central bank communicates and eliminating some of the most important market data we have—such things as the dot plot (he refrained from providing dots) and forward guidance on Fed policy. As the accompanying chart shows, comments on forward guidance jumped in news reports of the June 17 FOMC meeting, graphic evidence that it was not business as usual.
Investors have not always had this information. When I began in the investment business 50 years ago the Fed secreted its monetary policy. There was no announced target for federal funds. Instead, investors focused their attention on Telerate screens just before noon (eastern time) each day when the Fed’s open market traders would enter the market. Primary dealers would report whether the central bank was buying securities (“doing repo”) to inject money into the system and ease conditions or selling (doing “doing reverses”) to drain liquidity. We’d have no idea of the volume of their activities. But we would observe the level of federal funds just before the trading and from this deduce whether the Fed was maintaining, tightening, or loosening monetary conditions.
Free Markets and Transparency
It was free market advocates who initiated Fed transparency. Alan Greenspan’s Fed introduced a brief policy bias comment into Fed statements in 1999 and extended the commentary in 2003. This evolved into forward guidance a decade later.
The dot plot grew from the mandate that the Fed report semiannually to Congress. Ben Bernanke created the quarterly Summary of Economic Projections (the basis for the dot plot) in 2007. It currently includes a dot plot (introduced in its current form in 2012) that shows the outlook for the pace of growth, inflation, the unemployment rate and overnight interest rates for the succeeding two or three years and in the longer run representing what the Fed characterizes as the “projected appropriate monetary policy.”
Ironically, Warsh, who now seems to want to reduce transparency, was viewed as a strong Bernanke ally when Warsh served as a Fed governor from 2006-2011. He and Bernanke put forward a strong effort to use communication as a tool to support the markets when they were overtaken by the 2008 financial crisis.
Market for Lemons
The rationale behind Bernanke’s initiative is the efficient market theory. It was first described in a 1970 paper by George Akerlof, “Market for Lemons” that sought to explain the characteristics of the new and used car markets.
At the heart of this theory is the view that more and better information will lead to more efficient, liquid markets with less price volatility. Realtime reporting of trading prices and volume and expanded availability of common source government-provided economic data became the norm. Market regulators required this, and systems were developed (think Bloomberg, FactSet, Reuters) to compile and analyze volumes of data.
The goal was to find the “fair value” for securities and to inform buyers and sellers simultaneously. That was supposed to shrink bid/offered spreads, improve liquidity and reduce volatility.
The growth of the internet expanded access to data, and recently the development of artificial intelligence holds out the possibility of further democratizing knowledge and analytics so that public sector and other investors would be on a (somewhat) level playing field with the big players.
The Fed’s Mandate
Bringing this back to the central bank, if the published view of the Fed was that the economy would grow at 3%, inflation would run at 2%, and the Fed’s target rate would be 2.5% over the next several years there should be little doubt as to the value of a two year Treasury note. And there would be more confidence in evaluating the level of long-term interest rates than if one took a random walk.
That was a central theme for a while, but the Fed missed the beat around the post Covid inflation surge and the more recent uncertainty about the path of the economy.
Perhaps we should accept the reality that forecasting knowledge is useful but not perfect and redouble efforts to improve data and data analysis.
Instead, these days there is an alternate market information theory that is gaining attention. It goes something like this: too much data creates overload and false confidence in outcomes and can actually foster market volatility.
This view, largely relegated by economists to second place a generation ago, has new power, perhaps because it supports a version of “free” markets, perhaps because it can justify reducing the presence of government oversight in the markets, or perhaps because it is aligned with instinct-based investing that has led to some remarkable meme investment results.
If the Warsh-led Fed scales back or eliminates forecasts and explanations it will not be alone in moving away from transparency. The Securities and Exchange Commission’s proposal to permit reporting companies to file semi-annually rather than quarterly would mean less current data to support credit judgements on corporate bonds and equity valuations based on financial information.
Trump administration proposals to reorganize and consolidate activities of the main federal statistics agencies could mean less data or less frequent publication of data. Inaccuracies in initial reports of high frequency data like the monthly jobs report might be addressed by reducing the frequency of publication from monthly to quarterly. That was suggested by a Trump administration nominee to lead the Bureau of Labor Statistics (who subsequently withdrew from consideration). It would certainly reduce market volatility on the first Friday of the month when the report is published, but would it really improve overall market efficiency? (If you answer “yes,” why not simply eliminate the employment report entirely so that market prices are no longer influenced by this data?)
Transparency implicates data quality, access, and the power to analyze data. Government-provided data is now available to all investors, large and small, at the same time, and great efforts have been made to democratize access to it.
But there are worrisome countertrends. Reducing frequent publication of open-source data could advantage proprietary and AI-based data collection and analysis by those with deep pockets to invest in compute and thus gain a market advantage. Decision makers, whether at the central bank or elsewhere in government, who meet privately with investors may convey information that leads to market activity (or, equally worrisome, to the perception of this result).
Bottom Line
The Fed’s pronouncements are not unbiased. They are likely to be optimistic, particularly in times of trouble, but this is or should be recognized by investors and factored into analysis.
Nor are their forecasts completely accurate. But they do provide important guidance to investors and, just as important, they set forth a standard for accountability. If the central bank sets forth a long run target for inflation of 2%, other policy makers and ultimately voters can consider whether that is the right target, how far from the target we are, and whether we are progressing toward it at a satisfactory pace.