
Unsettled Times, So Hunker Down
 Last week’s Research Note “The R Word” perhaps seemed a bit off track to some folks, but the above chart, published Friday by the Atlanta Federal Reserve, captured a lot of eyes. It looks eerily like the same chart in the first quarter of 2020 when Covid shut down the markets and the economy in a rapid sequence. (More on that below.)
This week Wall Street has begun to raise the possibility of recession, with Bloomberg reporting that major firms like JP Morgan and Goldman Sachs have upped their estimates of the probability of such a downturn.
The National Bureau of Economic Research is the judge in this matter. It describes a recession as a “significant decline in economic activity that lasts more than a few months.” The popular definition among economists generally focuses on a negative growth rate for gross domestic product and a rise in the unemployment rate, but the actual measures employed by NBER are a bit more targeted toward assessing aggregate demand, the trend in real personal income less transfers, personal consumption expenditures and payroll employment (not the unemployment rate). Oh, but for the details.
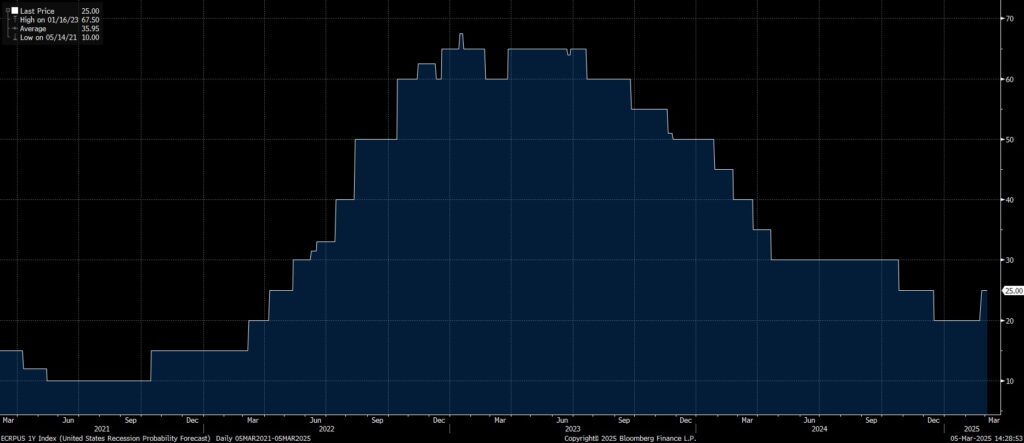
Then there is the popular definition of recession. Surveys through much of last year showed that many consumers (voters?) felt the economy was in recession even though the data showed not. And going back a bit further, as we noted in our Research Note, Wall Street’s recession indicators showed a high probability back in 2023 when the economy was creating an average of 160,000 jobs a month, the unemployment rate was below 4% and GDP was growing at better than 2.5%.
The details.
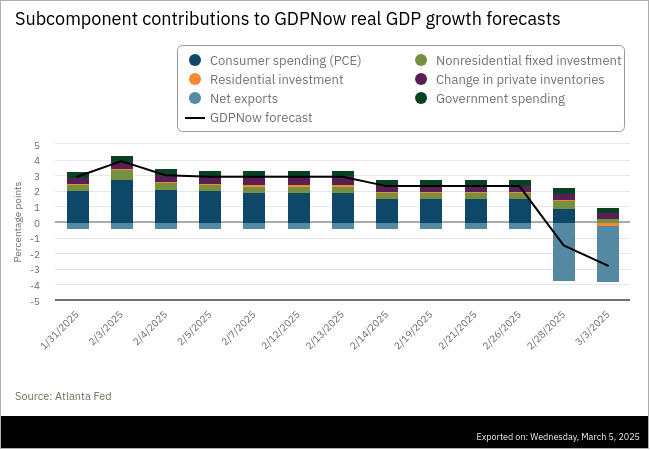
A look behind the chart at the top of this post reveals a dramatic change in the main drivers of economic activity. Consumers have been the mainstay of the economy for years and an apparent downturn in consumer spending led to the sharp downward revision in the GDPNow forecast. The below chart plots this. Recent measures show consumer spending slowed notably since the start of the year. Since consumption amounts to about 70% of GDP, that’s a big deal. The rate of growth in investment also slowed, and exports, which generally have modest net effect on GDP, suddenly have become a big drag.
This, by the way, is very similar to the pattern we observed in 2020, but obviously the cause is very different. (See the chart below.) There is no shutdown (and no panic as we experienced in 2008). It’s just that consumers, perhaps racked by uncertainty (over inflation, taxes the role of government, etc. etc.) have gone from ebullient to cautious, seemingly overnight.
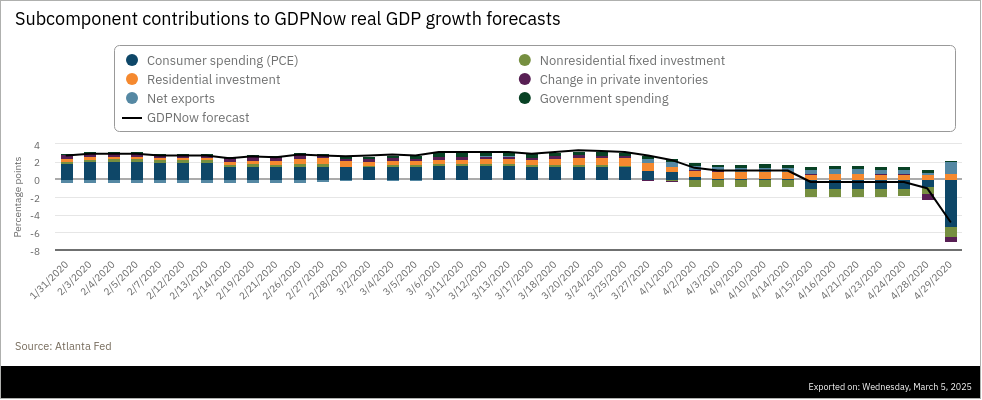
Not that we’re suddenly headed into a recession. That we do not know. But a comparison of the two periods provides focus on the main drivers of US economic activity and the risks that have now come to the fore.
Timing is (nearly) Everything.
Downturns can happen suddenly, or they can creep into the economy over time. In 2020 the collapse of consumer spending brought on the recession quickly and it took several years for the economy to recover. Importantly the Research Note last week observed that there is a timing mismatch between the impacts of changes in the drivers of economic activity. The pace of activity runs by one clock, while the potential offsets—changes to fiscal and monetary policy—run by others. In plain words, if the economy slows the Fed may reduce rates but this likely will happen only after the slowing is observed, and then it will take time before lower rates actually affect economic activity. The fiscal response normally also has this delay but this time it’s hard to know how the budget deficit and political polarization would affect fiscal policy. Will Washington step in to the “prime the pump”?
What this means for state and local governments
In a few words, state and local governments will be squeezed on both sides if the economy slows or dips into recession. The end of post-Covid federal aid programs will mean a significant source of recent revenue will disappear. Other sources may be interrupted or terminated as the President and Congress grapple with the ballooning federal deficit. This could lead to a draw-down of state and local government surplus/reserve accounts to the extent public agencies step in to fill the funding gap and preserve programs. We’ve already observed this in our just-completed annual survey of state-sponsored LGIPs, which has identified a drawdown of state investments in programs that accommodate both state and local government funds.
States and localities will have to consider the extent to which they step in to make up for cuts in federal programs. Medicaid is the one that has gotten the most headlines to date, but more than a quarter of state and local government revenue came from Washington in 2021.
Lower interest rates will also reduce interest earnings. Based on the Federal Reserve’s estimate of total state and local government investment assets, earnings contributed $175-$200 billion to state and local government revenue in 2024. A return to lower interest rates (say 3.00% on Federal Funds) could reduce this to $120 billion. A recession that resulted in a major cut to the federal funds rate could reduce earnings to under $50 billion within a few quarters. The Pew Center also identified this trend, and has just published an analysis that looks at the trend in state investment earnings over the past several years. (Hint, the title is “State Investment Earnings Boomed. Will Policymakers Be Ready When They Bust?”)
What does it mean for investment strategies?
There is more than the usual uncertainty when it comes to the path forward for the economy and for short-term interest rates. Even (most of) those who foresee a bright future with growth accelerating to 3% or more and inflation subsiding recognize that the path toward this goal will be uneven. There is likely to be a dip (or drop if you are a pessimist) in the level of economic activity. The Fed has forecast a modest decline in its main policy rate over coming quarters, but make no mistake, if the economy falls into recession the central bank will cut rates aggressively, perhaps to 1%, and keep them at this level until the economy recovers.
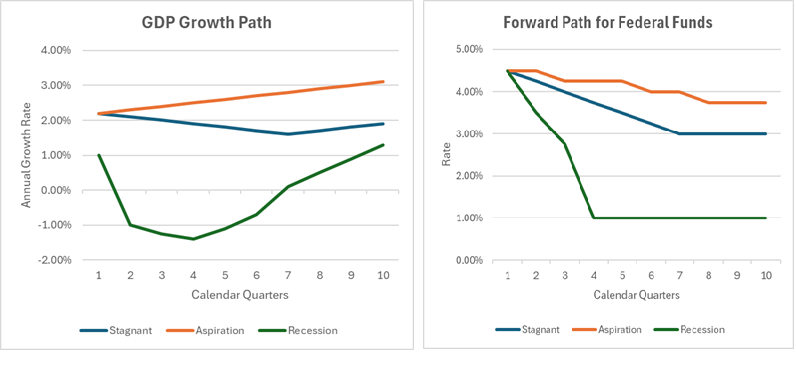 The accompanying charts suggest conceptually what three paths might look like. Slowing growth, persistent inflation that remains above the Fed’s 2% target, and an effective fiscal and monetary policy could produce a stagnant economy. In this scenario GDP growth slows to about 1.5% over the next 18 months, then gradually recovers toward 2%. The Fed gradually reduces its policy rate to 3%. Or the economy could fall into recession with growth dipping into negative territory, before recovering in later quarters. The Fed is likely to resort to the “helicopter strategy” of monetary policy advocated by Milton Friedman, by boosting the money supply (though the major source of helicopter money is usually fiscal policy). In this outlook federal funds quickly are reduced to 1%. The aspirational path sees the economy gradually accelerating toward growth of more than 3% in out quarters, but without a sharp rise in inflation. On this path the central bank is likely to be more cautious in reducing rates with the end point 3.75%. (Note: these are conceptual and illustrative only.) The best practice for a public funds investment manager would be to stress your investment strategy on multiple paths over a period of the next several years. Pay attention to liquidity, be cautious about making bets on market direction, and defend against the possibility that risks may rise for credit-based instruments (bank deposits corporate obligations).


