
Beyond the News: Strong Growth in Public Funds Assets, But What’s Next?
State and local government investment assets grew by nearly 14% in the 12 months ended September 30, 2024, according to recently released Federal Reserve data. The growth rate is far higher than the overall pace of economic growth or the rate of growth in tax revenue in this period and seems to be a result of some mismatch between receipt and spending of Federal funds but also an effort by public agencies to build reserves in the face of budget uncertainty.
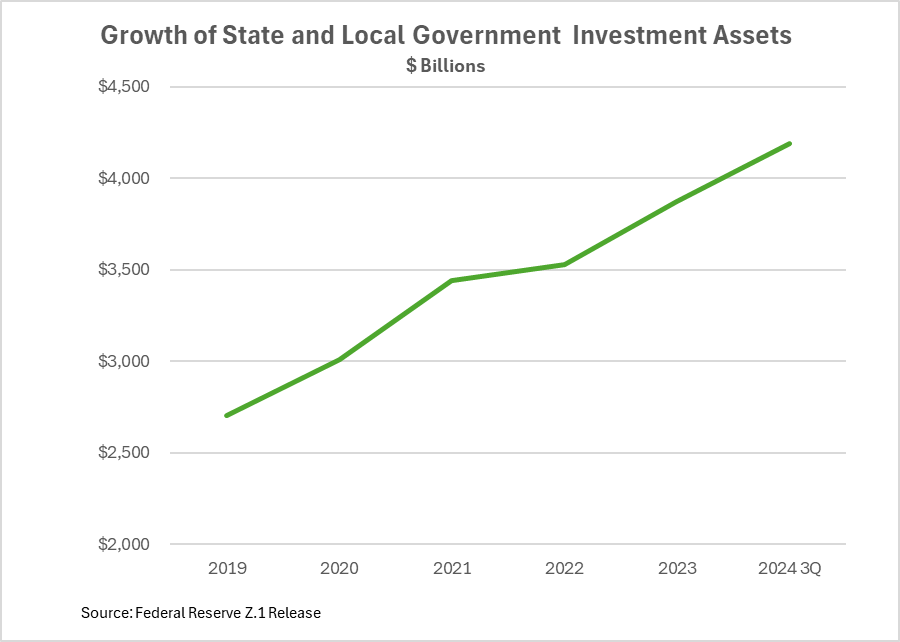
- Investment assets totaled $4.2 trillion at the end of the third calendar quarter, up from $3.7 trillion the prior year and $3.9 trillion at the end of 2023. The biggest increase was in Treasury holdings, which also are the largest holding. They make up approximately 40% of overall investment portfolios.
- The rapid growth was supported by investment returns that exceeded five percent in many public sector portfolios. Earnings may remain in portfolios where they compound.
- The strong growth in portfolio assets could well be a matter of timing rather than one of strength in the underlying drivers of portfolio balances. In particular, reserves of state and local governments may have been swelled by the timing of some Federal payments that will be drawn down in coming months to pay program expenses.
- The increase in investment assets comes at a time when many public agencies have turned cautious on their fiscal outlooks. With the Federal government running significant budget deficits, an extension of expiring Federal tax cuts under consideration in Washington, and pressure to reduce Federal spending, states and local governments could see significant reductions in Federal support and demands to make up for reductions in Federal programs to individuals and communities.
The details. Investment assets grew by 4.5% in the third quarter, the fastest pace in years. This capped the 12-month period of rapid growth that saw investment assets increase by $508 billion. The recent growth pace for investment assets has been uneven, as the accompanying chart shows, with a period of rapid growth tracking the post-Covid economic recovery and fiscal expansion, followed by slowing in 2022. Since then, growth in investment balances has accelerated, outpacing the growth rate of state and local government revenue. The variations seem to be a result of budget and spending decisions rather than changes in the underlying economic dynamics that could affect balances.
The trend of robust growth in public sector investment assets is also documented in data published by S&P Global. The rating agency’s information is limited to the local government investment pools that it rates. These total about $400 billion, or 10% of the assets tracked by the Federal Reserve. The S&P data show rated LGIP assets grew by 15% in this same period. A second measure, published by FitchRatings, tracks assets of a broader set of LGIPs, totaling about $600 billion. It grew by 8% in the 12-month period.
Changes in investment balances are not necessarily driven by the pace of economic growth or state and local government tax receipts. Indeed, gross domestic product (nominal basis) grew by 5.0% and state and local tax receipts were up 4.7% vs. the comparable quarter in 2023. Mismatches between the timing of revenue—especially revenue related to Federal Covid relief and infrastructure investment investment programs—and the decisions of budget authorities to build up reserves were likely the main factors in the fast pace of growth in investment assets.
The outlook for investment balances is uncertain. The growth is obviously much greater than the pace of economic expansion or of state and local government budgets. Chalk part of it up to timing disconnects between revenues and expenditures and part of it to what appears as a cautious approach to managing rainy day funds and other surplus accounts. For example. the National Association of State Budget Officers reported that state rainy day funds grew to about 14% of general fund expenditures in 2024, up from levels of about 4% in the pre-pandemic years.
The benefit of reserve balances, of course, is not evenly distributed among governments. Here there is a significant difference between the haves and have nots, especially given the uncertain path of Federal fiscal policy. We’re going to delve into this aspect in a future research note.
Zoom in. More than half of the increased assets were placed in Treasury securities according to the Federal Reserve report, with another 12% invested in Federal agency obligations. No doubt the ample supply of Treasuries and their liquidity were factors in this allocation. For example, Treasury bill supply grew to $6 trillion as of September 30, 2024, up from $5.2 trillion a year earlier.
At the other end of the growth scale, bank deposits grew by only 2.6%, or $19 billion and almost all of this—$16 billion—was in transaction-related deposits. While there may be local exceptions, banks generally have not competed aggressively for state and local government investment balances, and their share has been stagnant or declined modestly over several years.
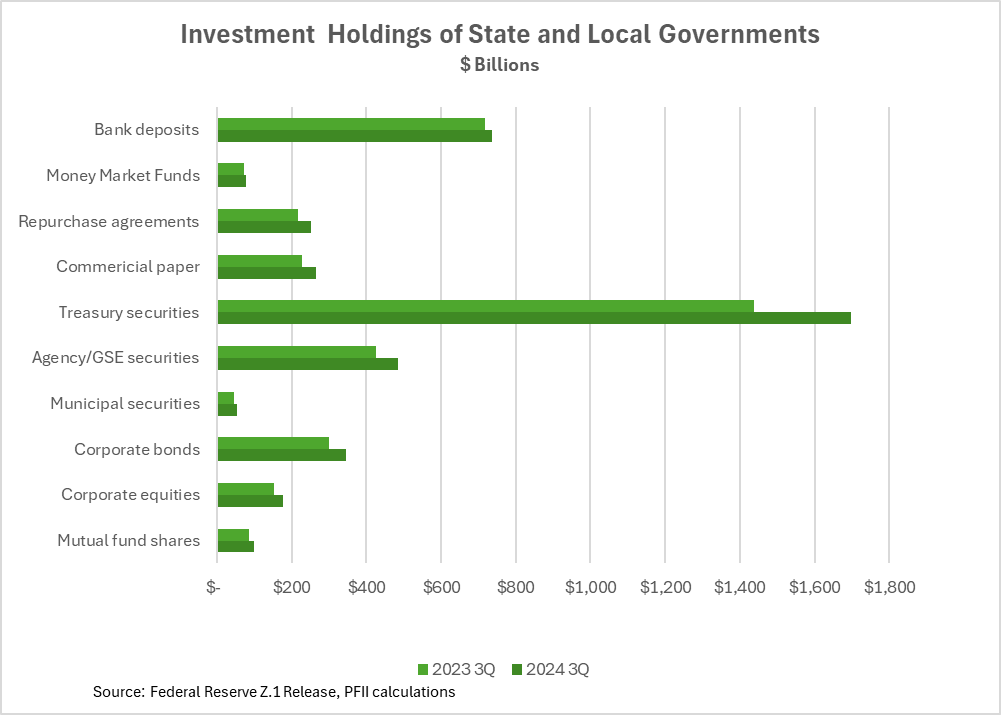
About 16% of the new assets were invested in credit instruments—commercial paper and corporate bonds. While these are in ample supply, it seems that slim pickups in yield and lower liquidity in these securities limited purchases.

The overall investment allocation of public funds was to liquid and high quality investments, with 52% invested in government obligations, another 18% in bank deposits, most of which are required to be insured or collateralized, and six percent in repurchase agreements. The allocation as of September 30, 2024 is similar to that at other recent periods, though with a somewhat greater reliance on Treasuries—they made up 37% at the end of 2021 vs. 40% as of September 30, 2024.
The Federal Reserve analysis does not account for the role of local government investment pools, an unfortunate shortcoming since these pools intermediate an estimated $900 billion in public funds investments. In the Federal Reserve release these assets are allocated directly to specific asset sectors. The result of this accounting omission is that the release likely significantly understates the liquidity of public funds investments as it accounts for only $78 billion in money market funds.
Bottom line. We’ve observed in the past that with interest rates at or near generational highs those governments that maintain significant operating reserves have seen a significant budget advantage. In total, the earnings on the $4.2 trillion of investment assets are likely to be around $200 billion this year—20 times the level of earnings in 2020!
Beyond that, it is valuable for financial and investment managers to ask this planning question: “Am I prepared for a [20] % drawdown of investment balances over the next year?” The unpredicted growth of balances and unpredictable future surely warrants this question.


